I built this interactive periodic table for my 501(c)(3) chemistry education nonprofit, ChemTalk. Very few good periodic tables exist online, and every one of them has downsides. The ones that look nicer often have poor interactivity, but ones with clean and intuitive interactions have outdated designs.

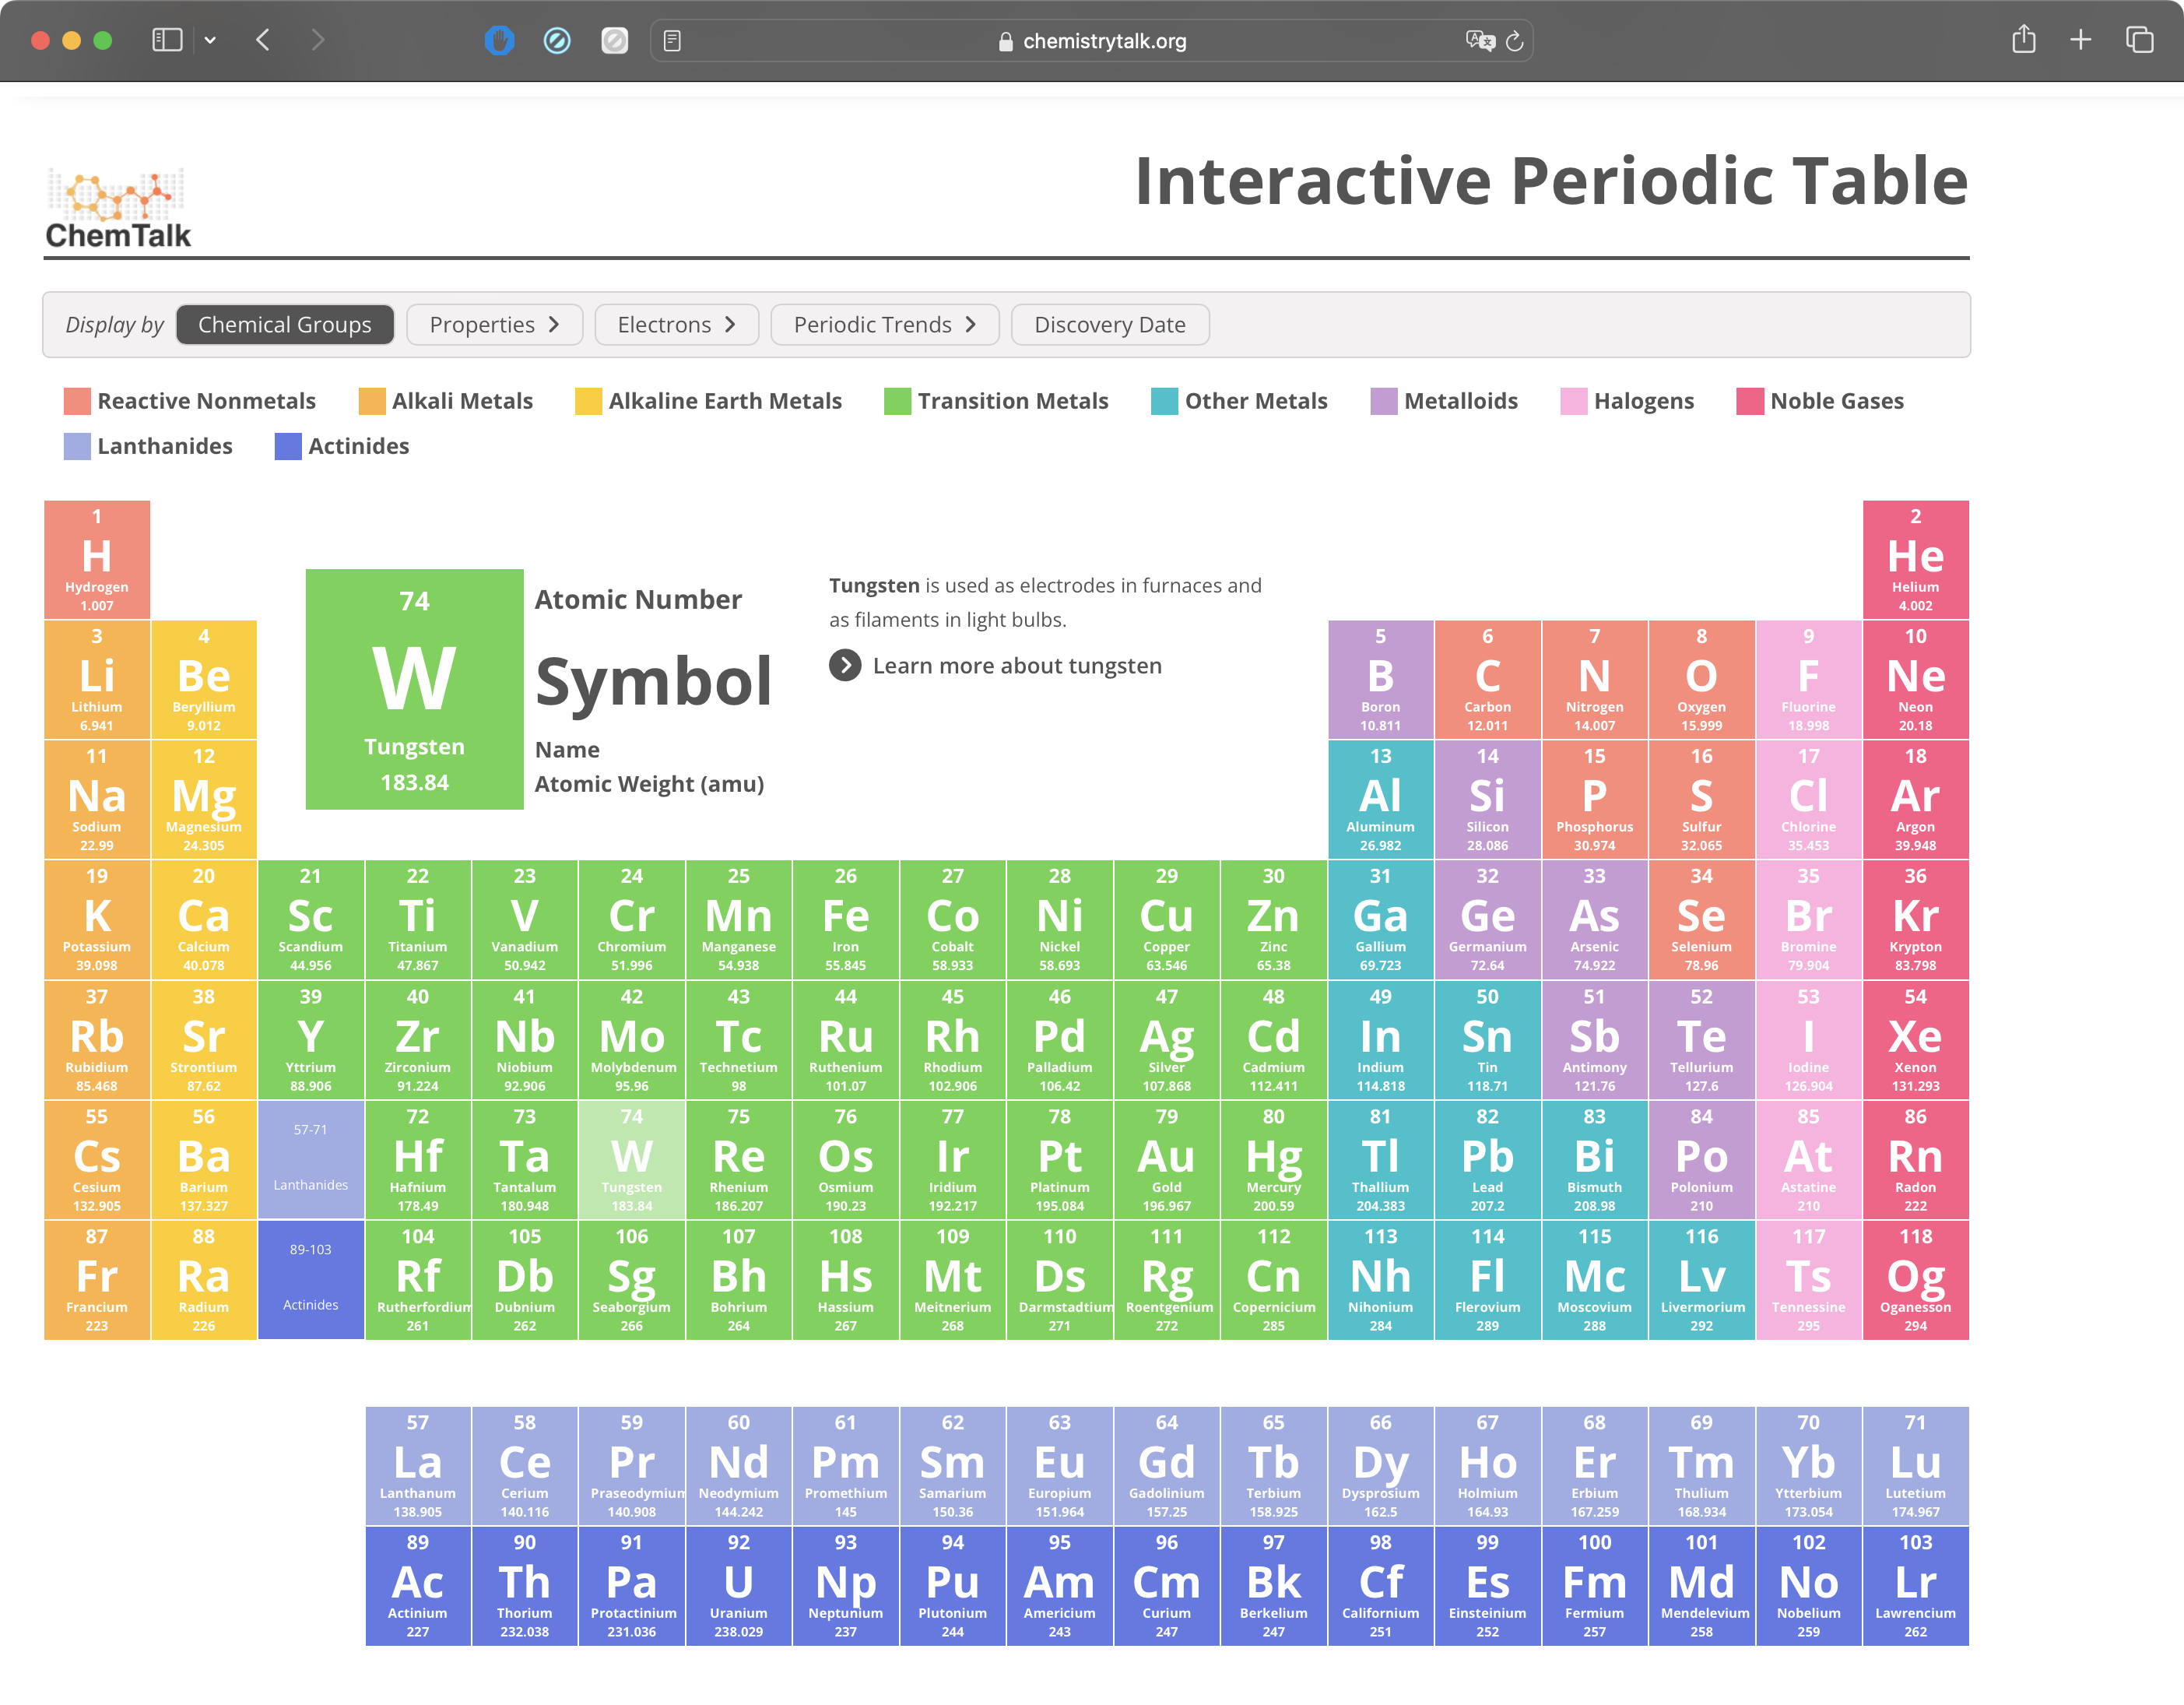
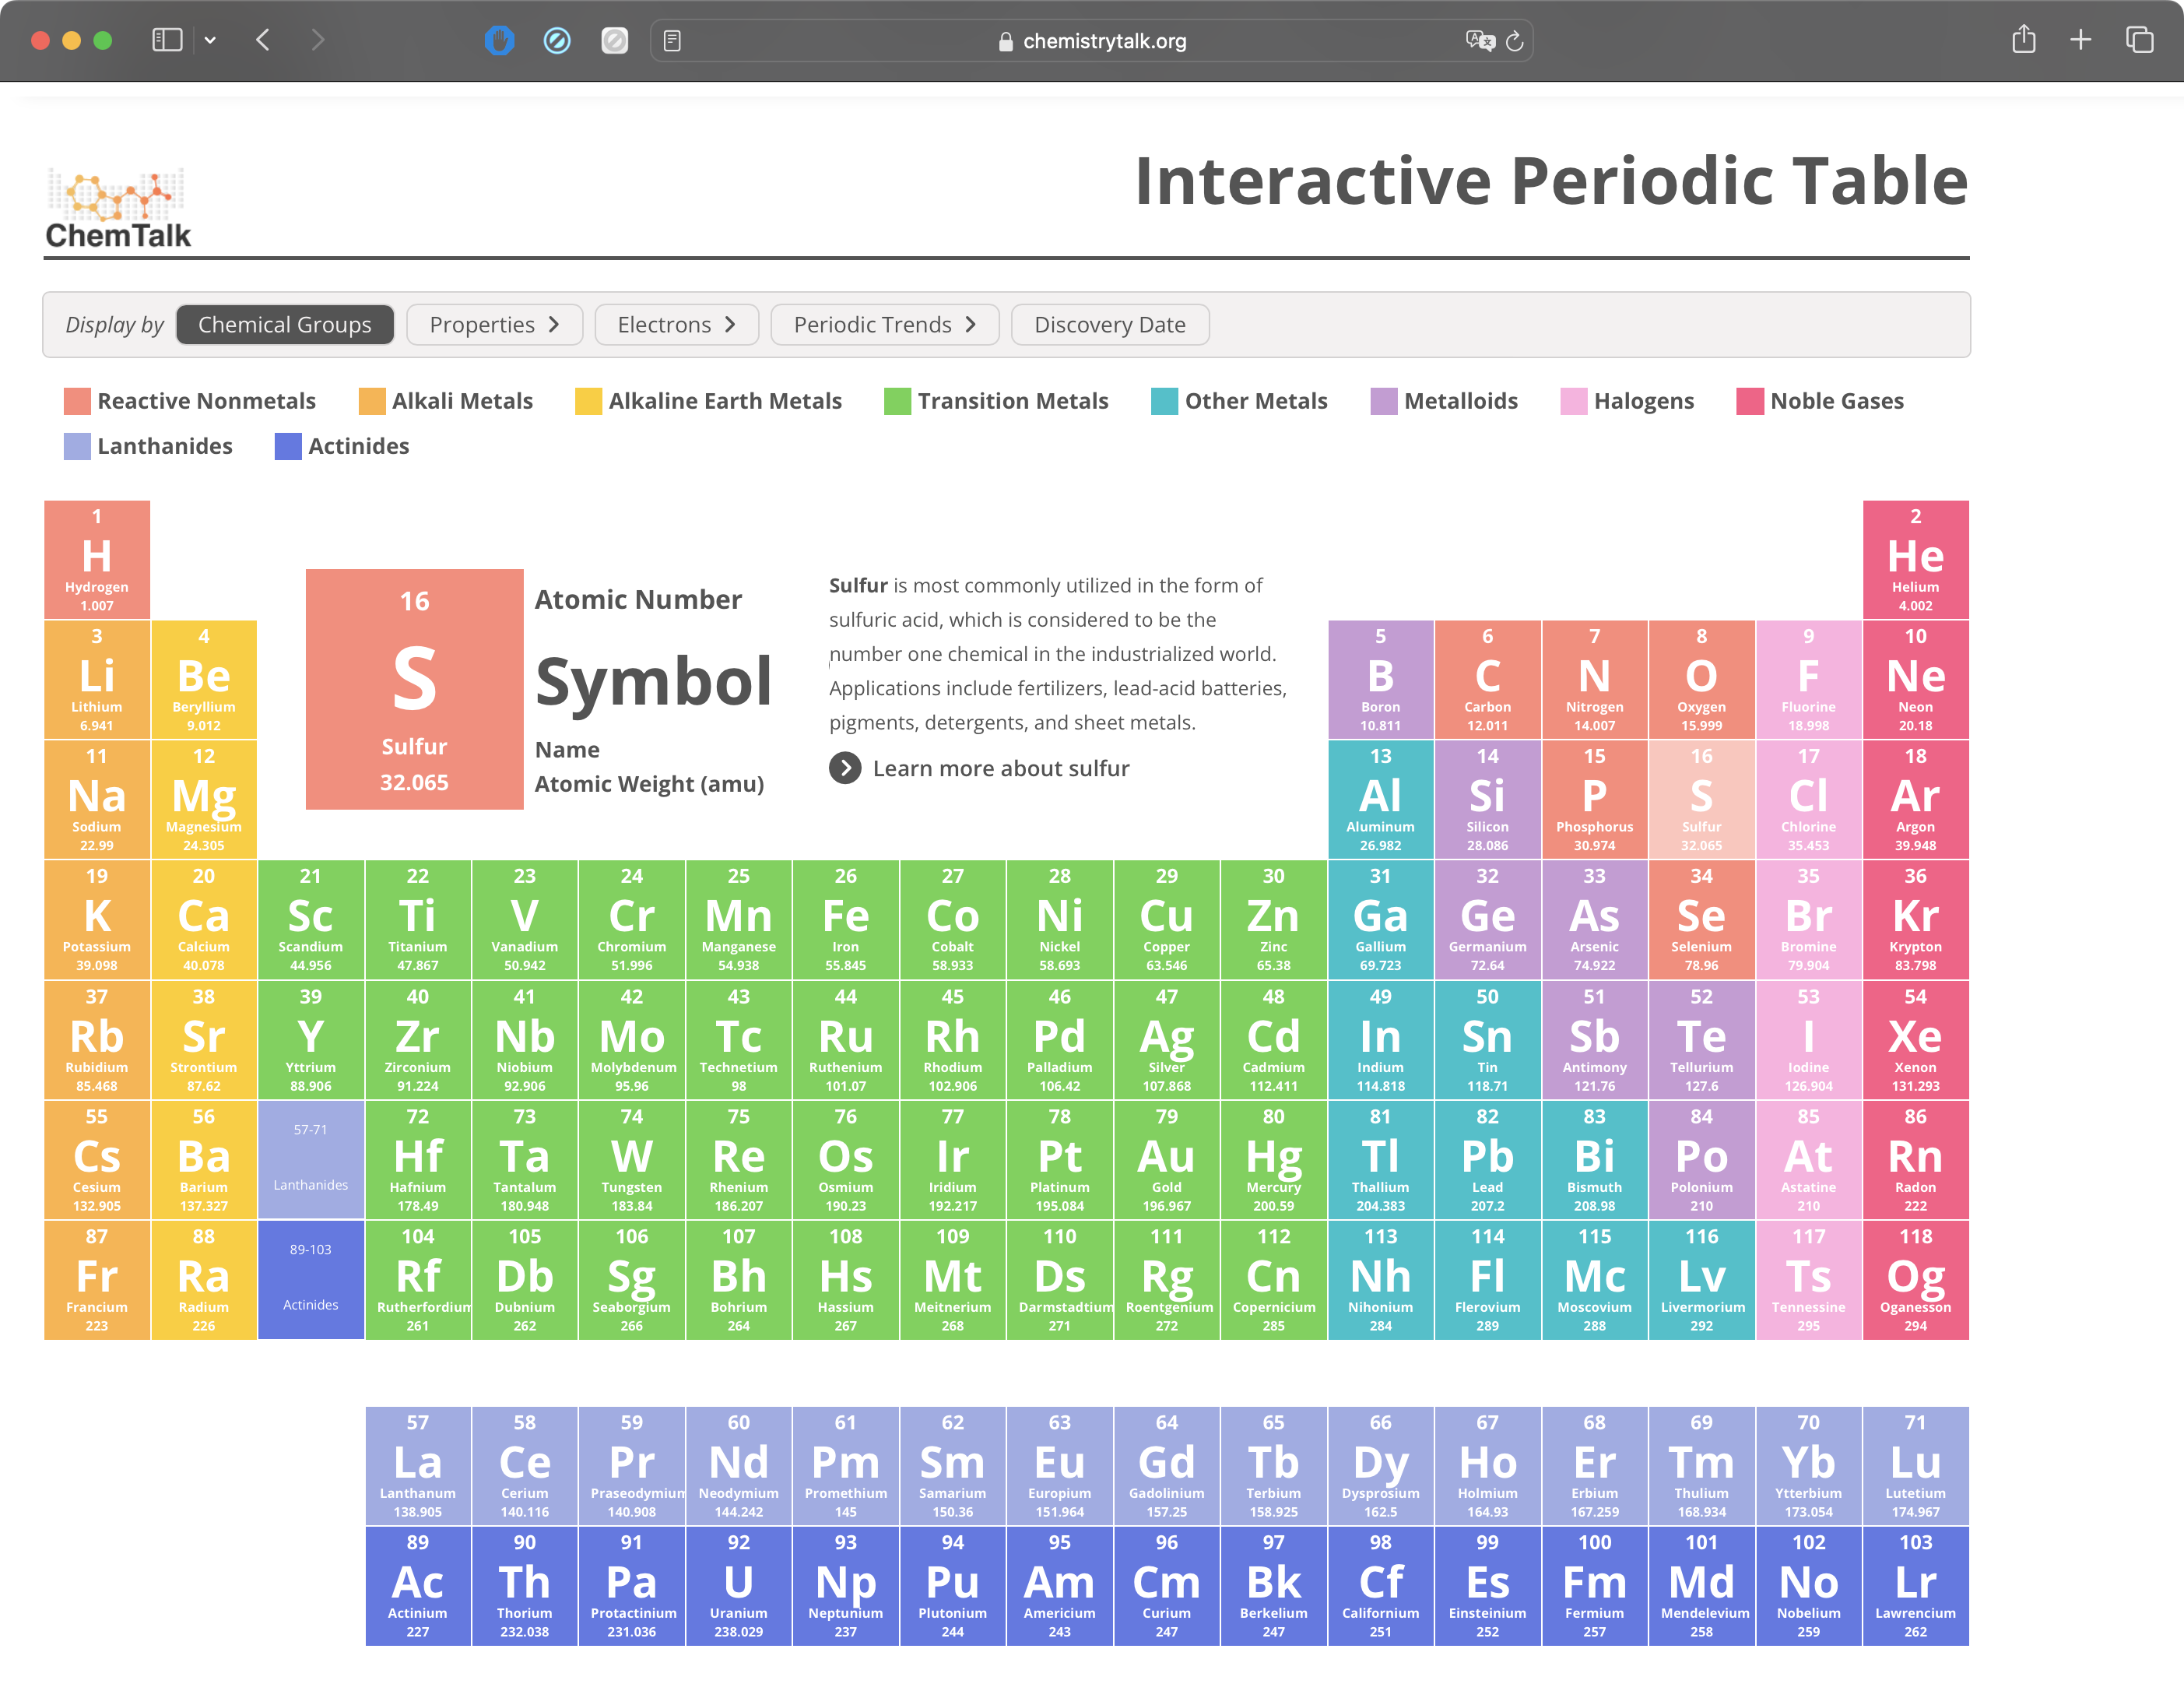
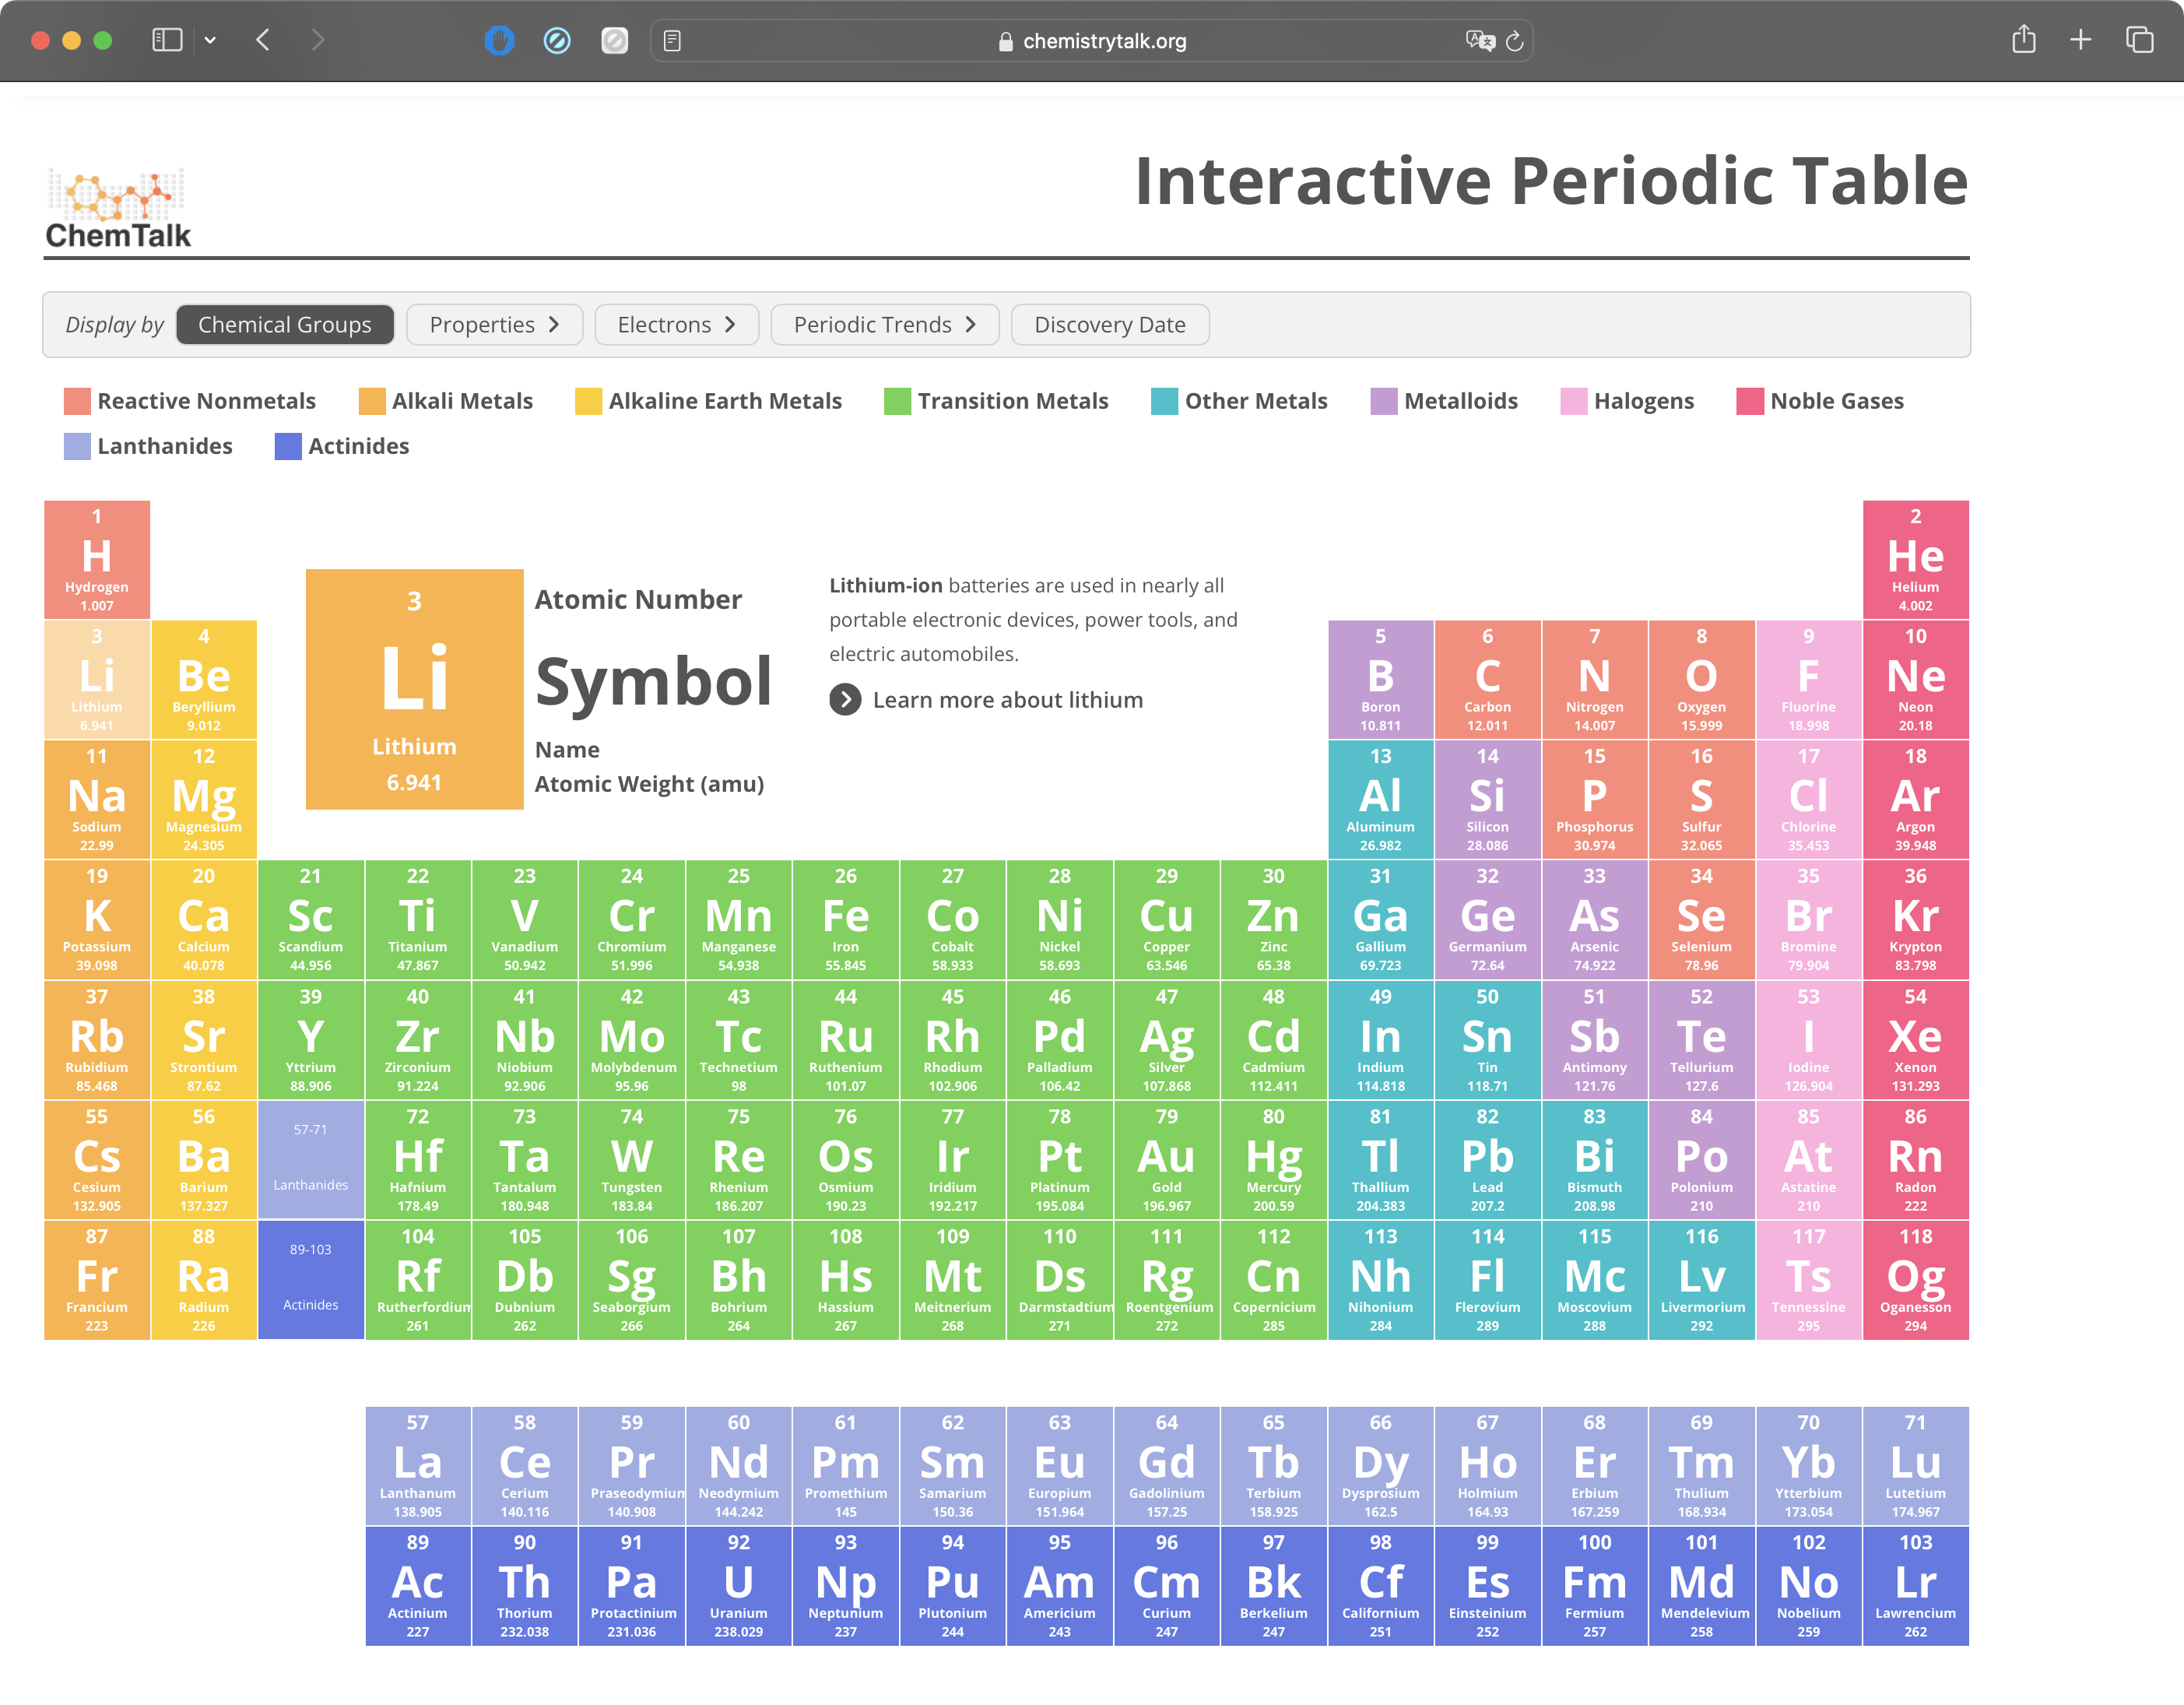
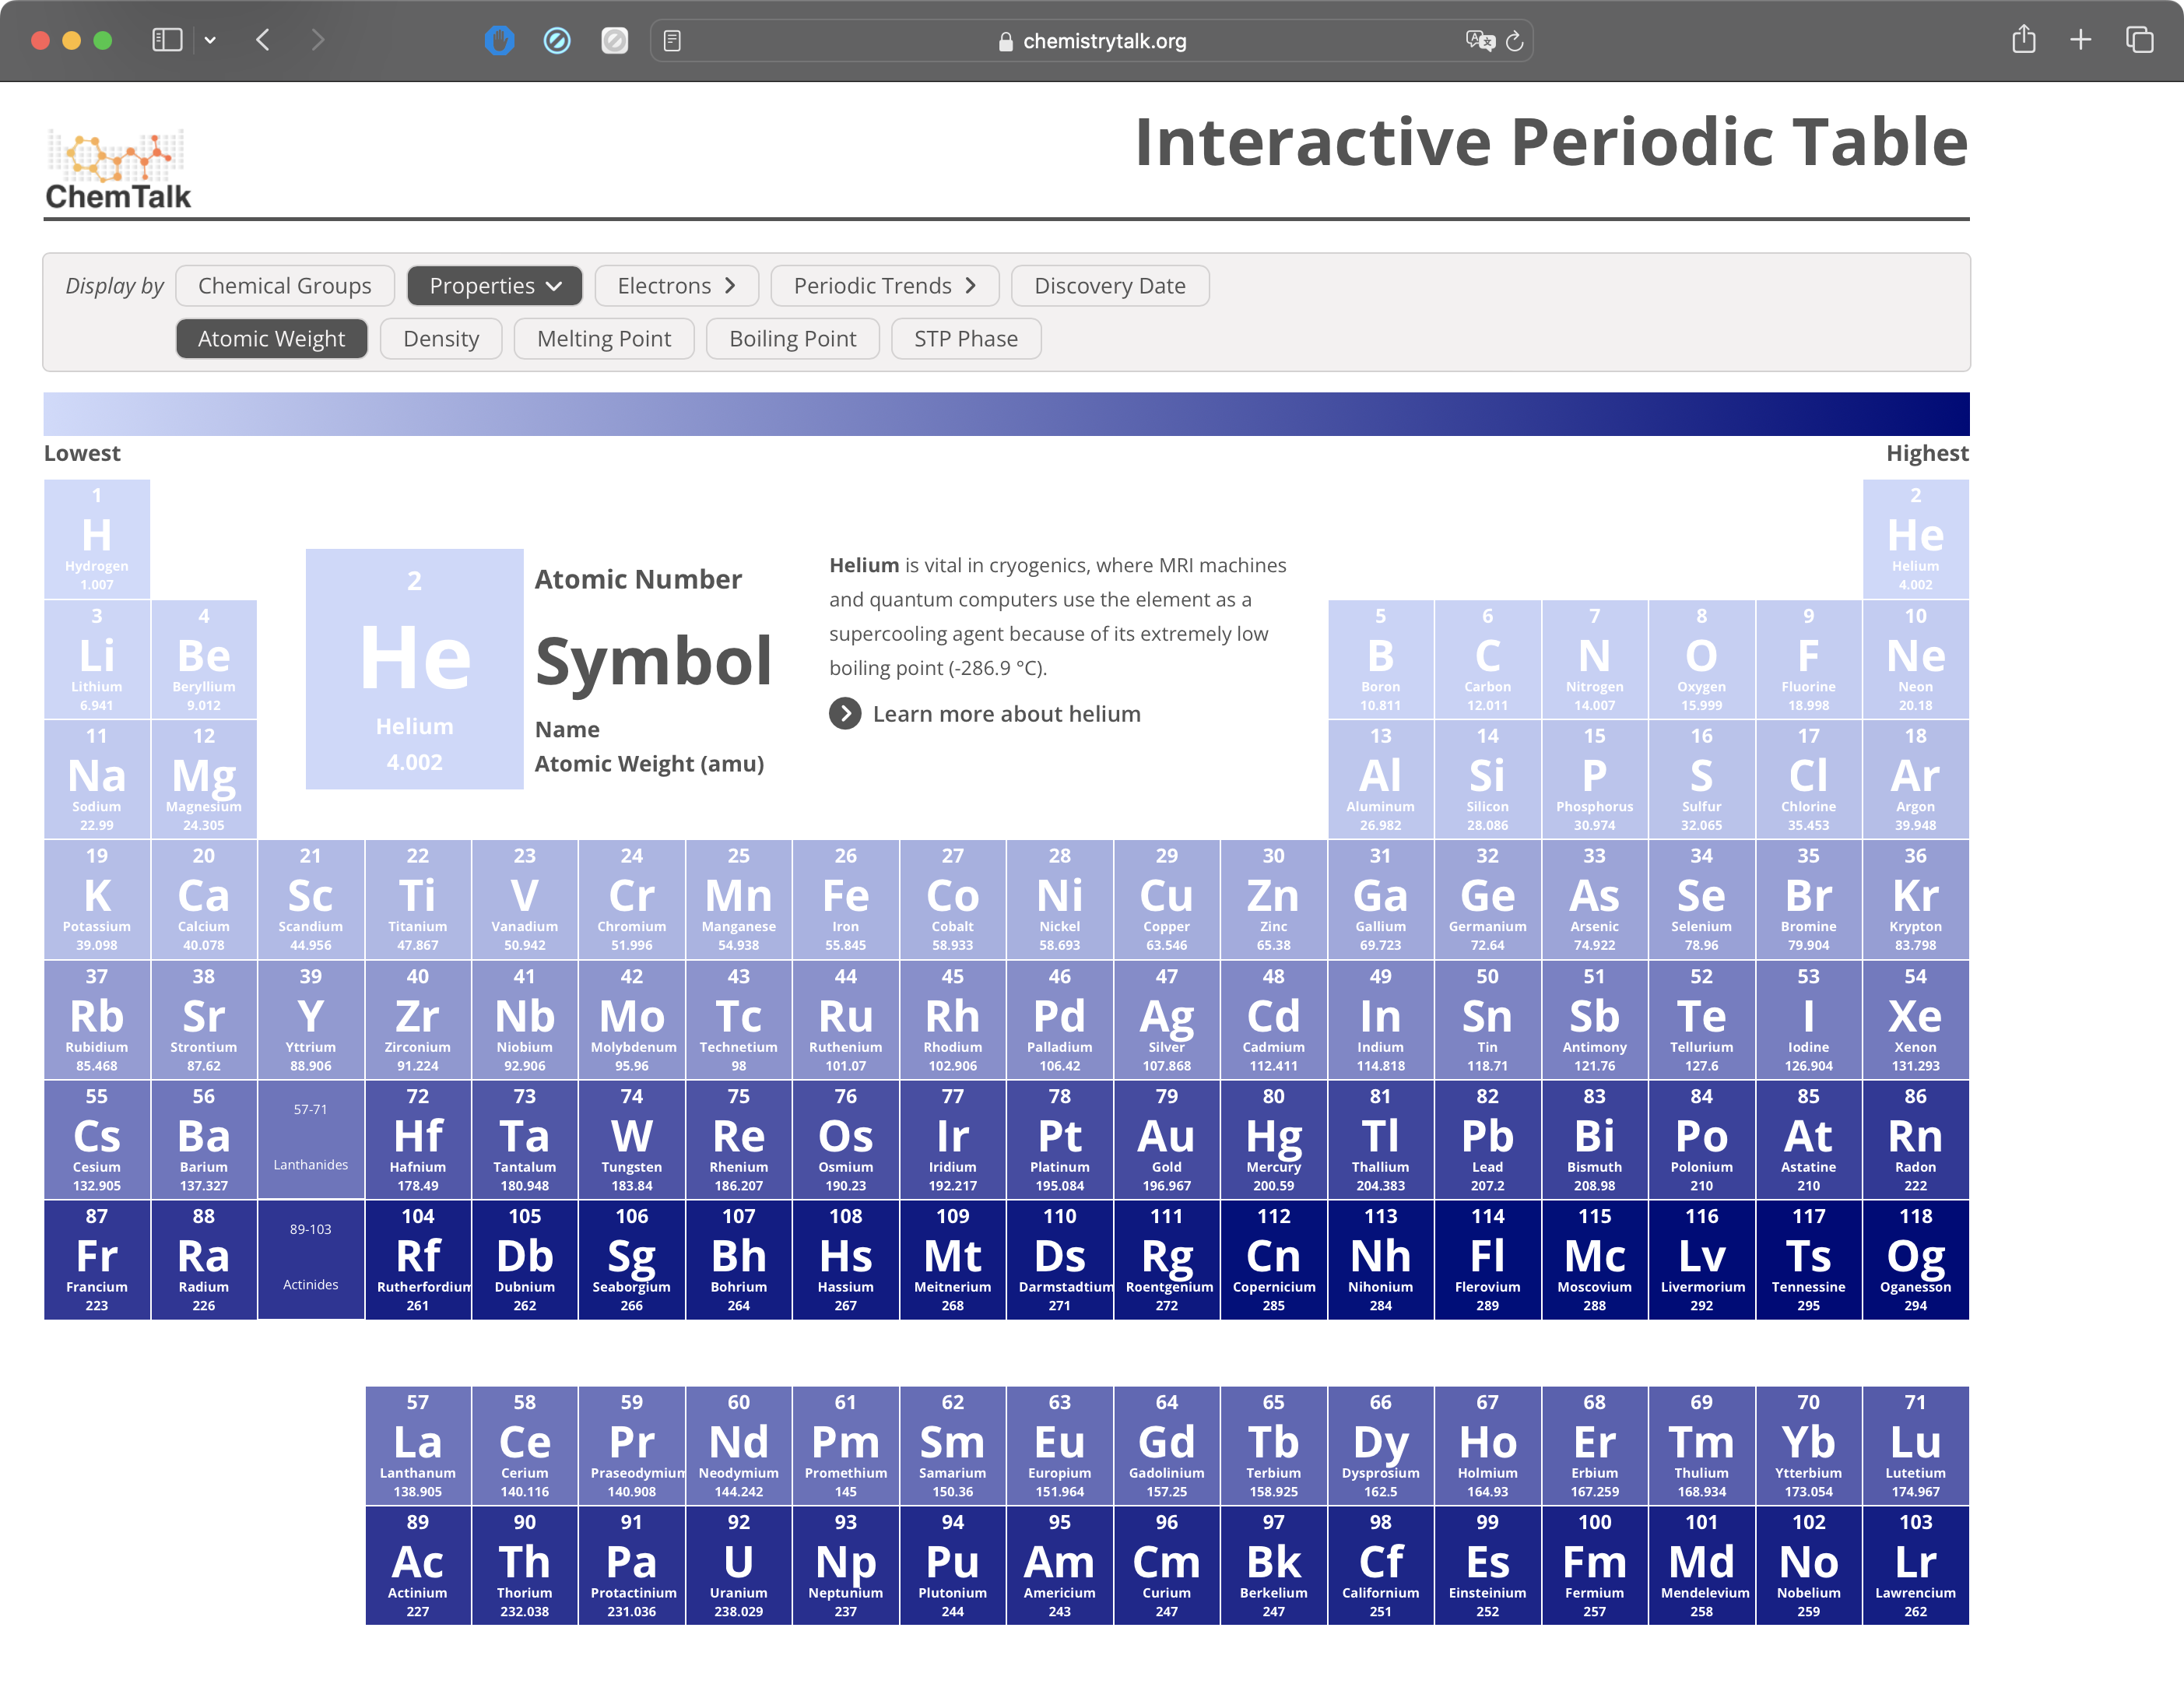
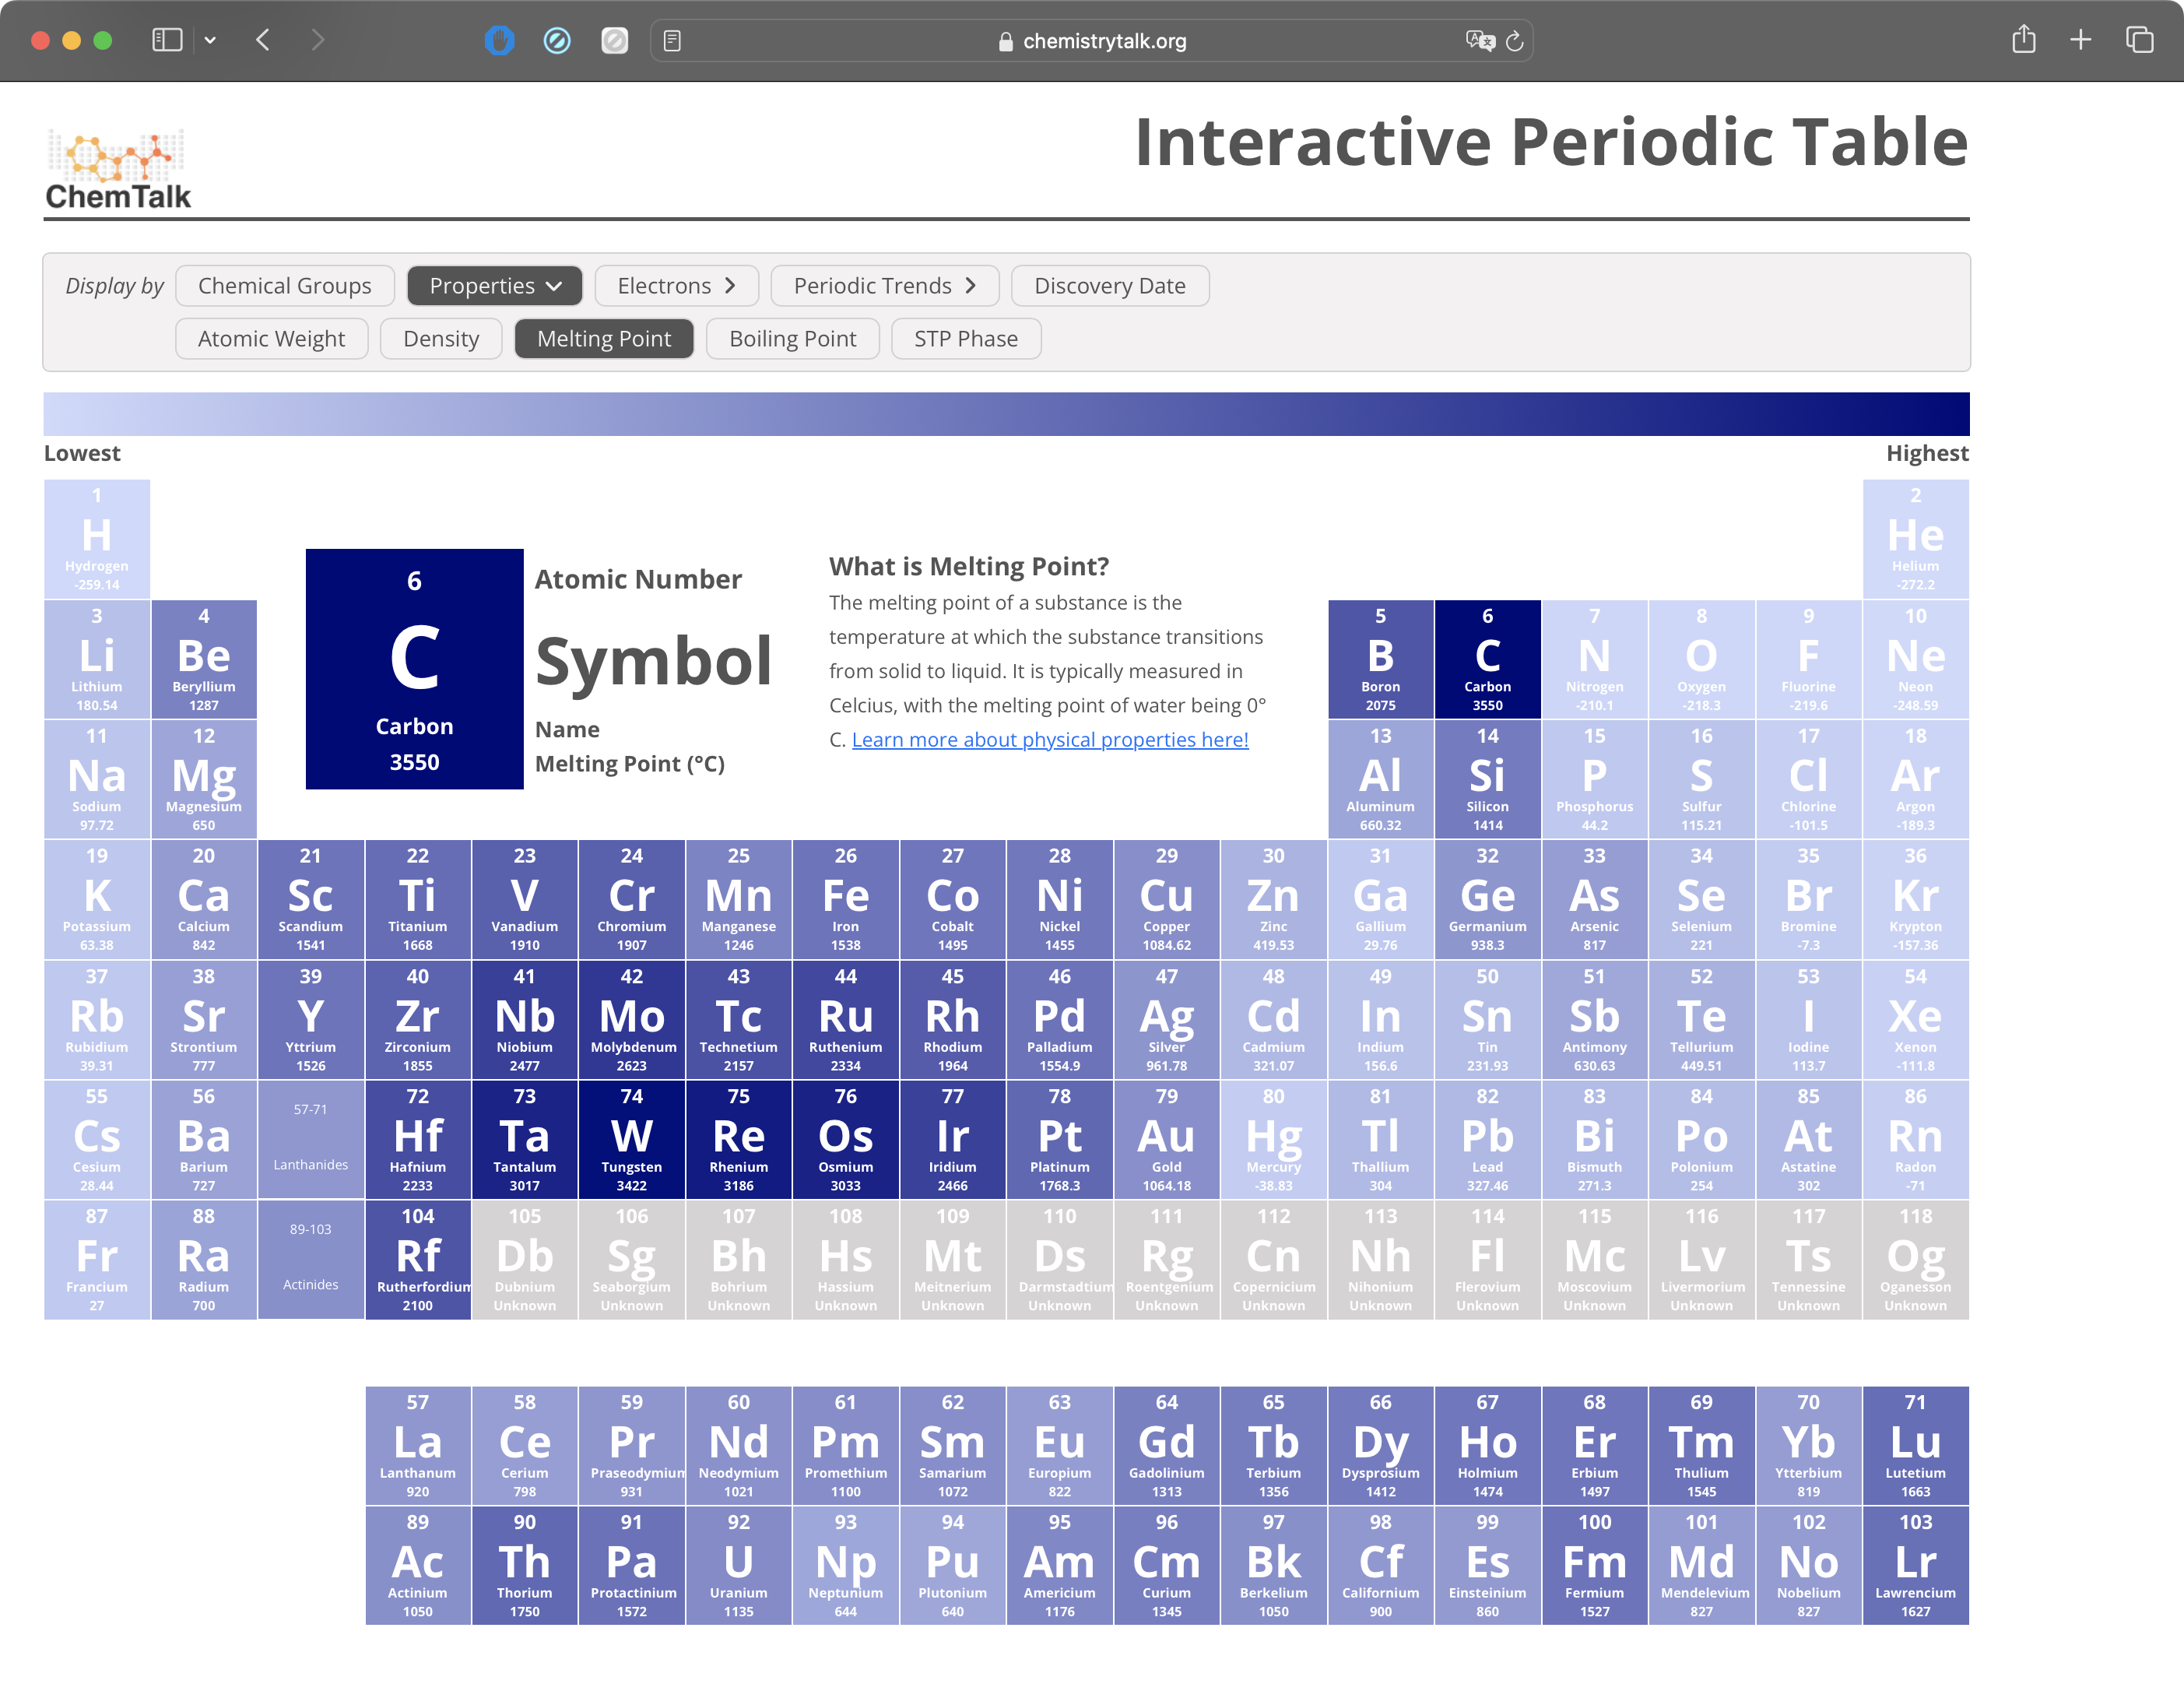
One of the main features of a good periodic table is the ability to see information about specific elements. By clicking on an element, you can see it's atomic number, symbol, and name. The following carousel shows what you see when you click on different elements. Clicking on the "Learn More" button takes the user to one of ChemTalks's articles on that element.

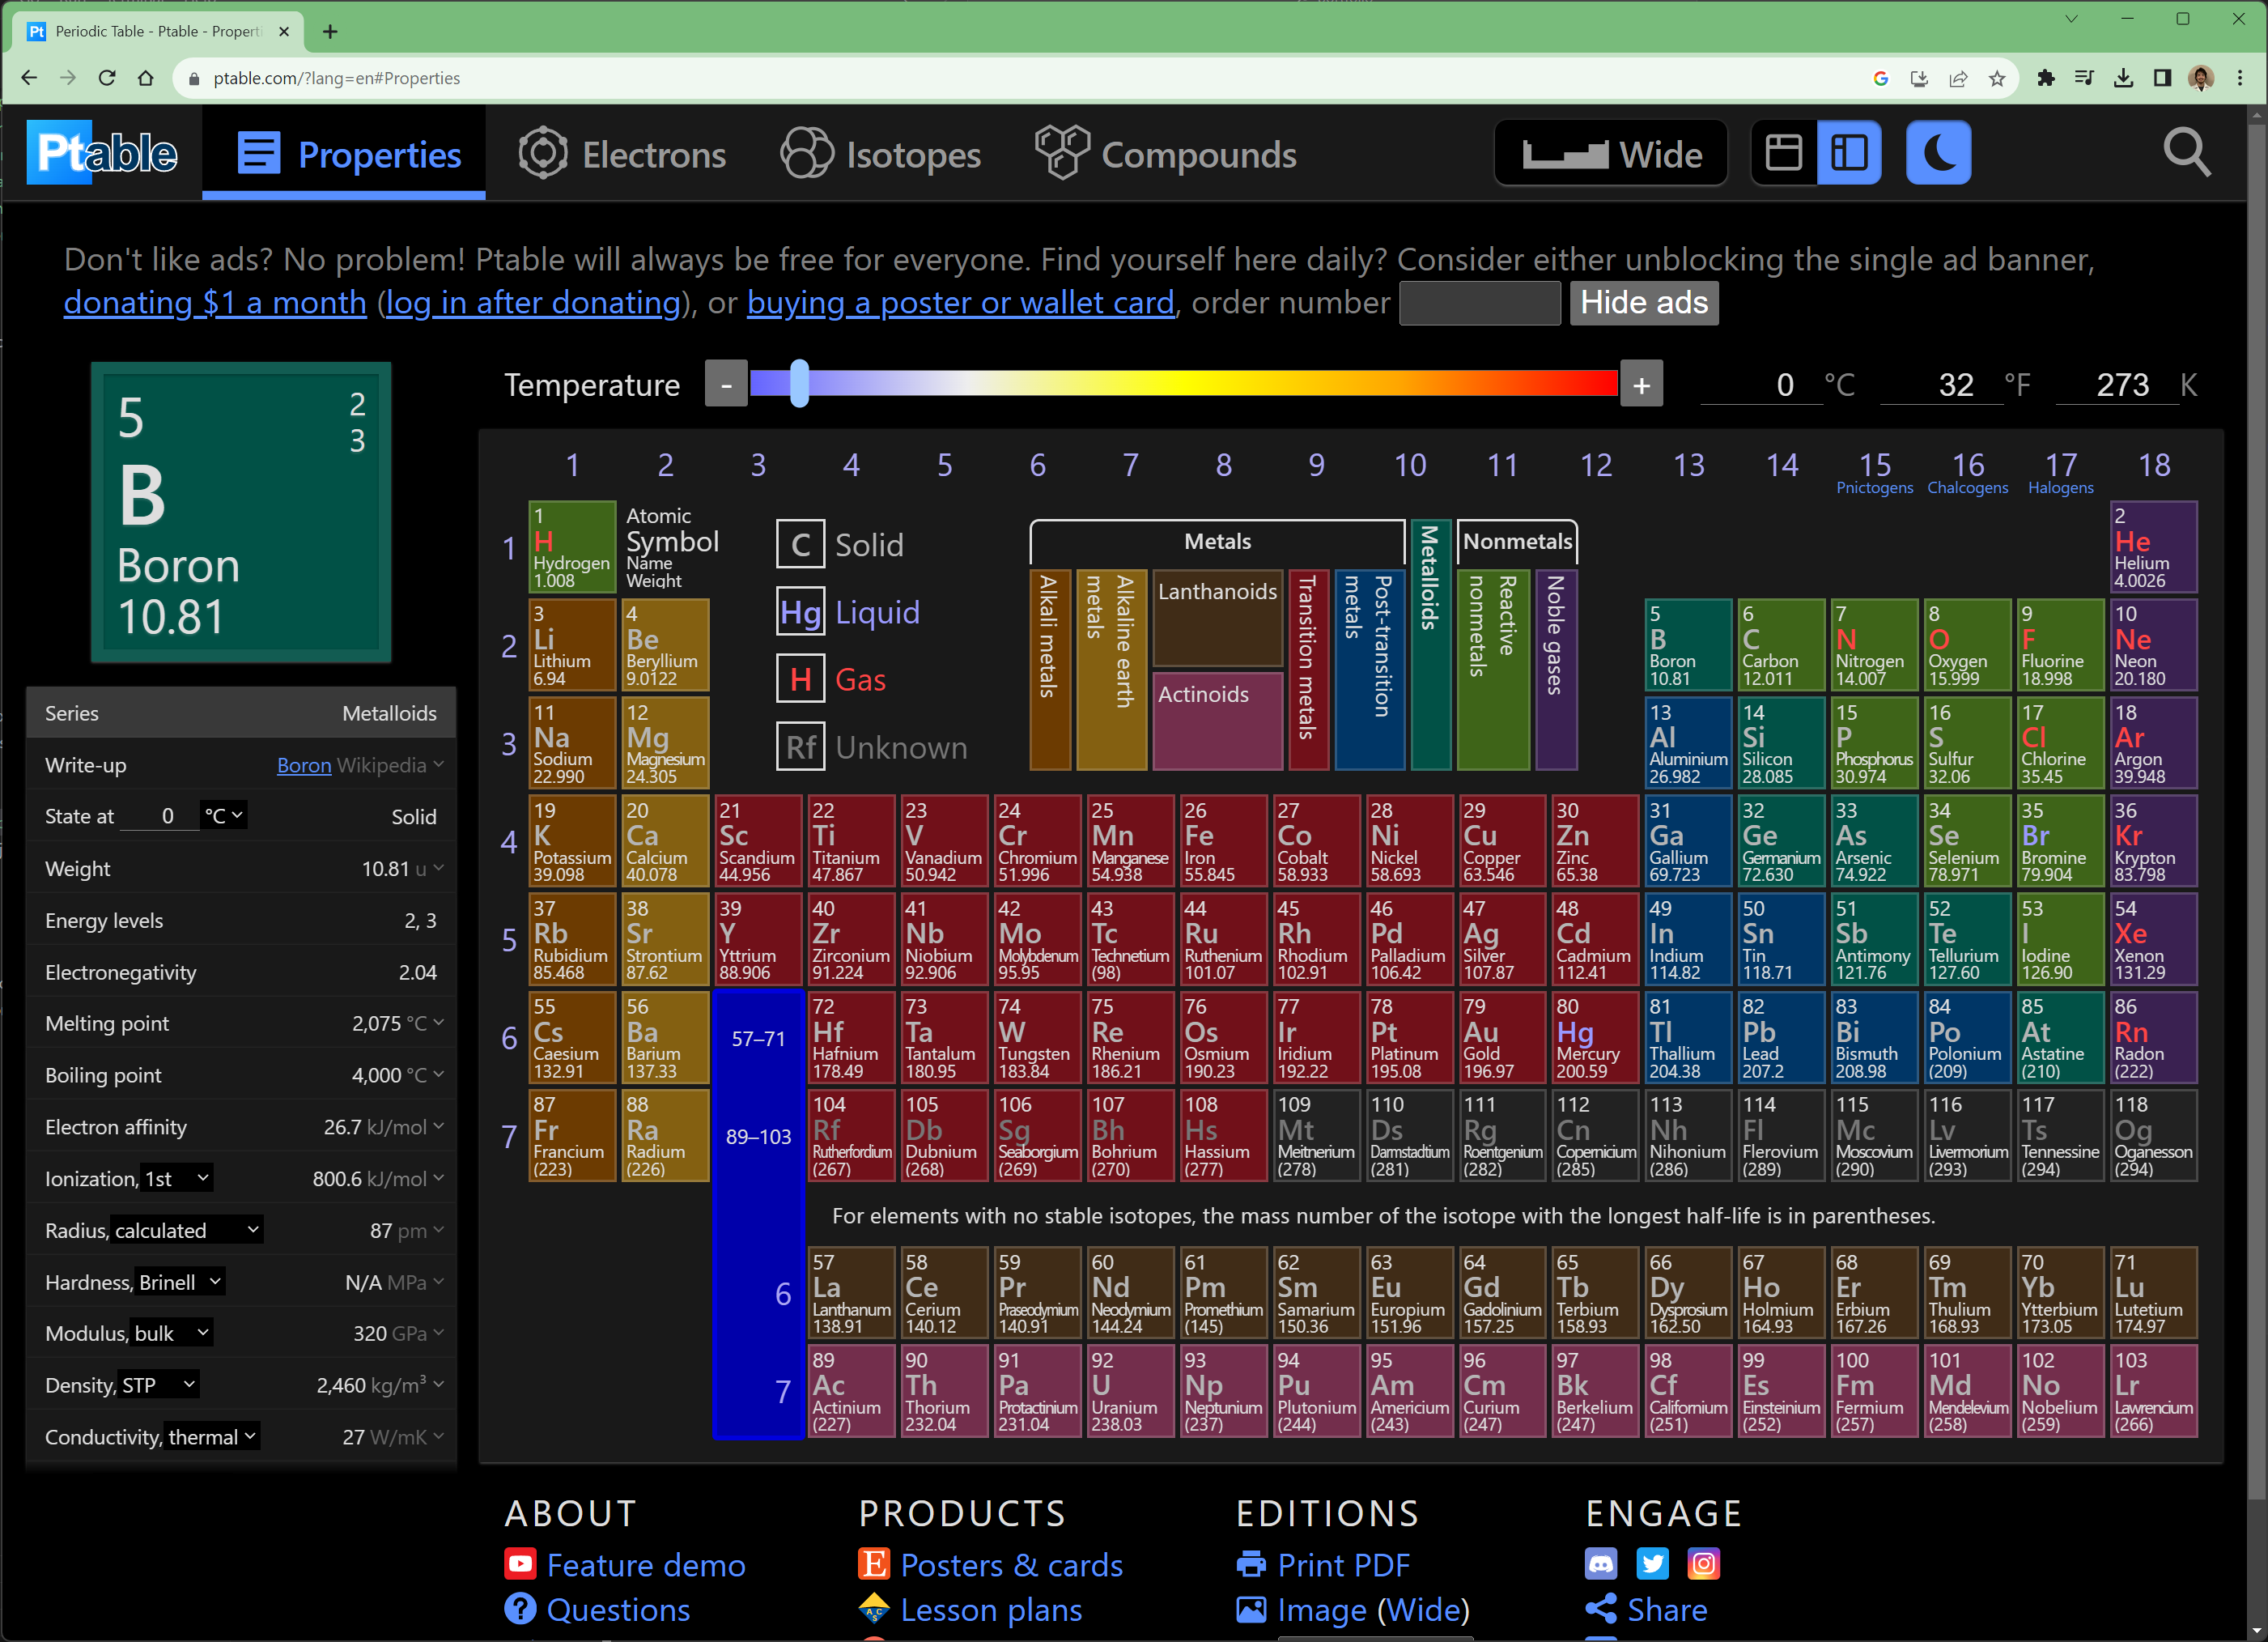
One of the main challenges I faced while designing this table was figuring out how to display all the relavent information in a way that was both intuitive and clean. A lot of online periodic tables (such as PTable, shown left) throw a lot of information at the user in an effort to make everything easily available. However, I felt that this actually offered a poor user experience due to the clutter.
This isn't to say PTable is bad. I used it for many years during my university education, but I think that UI/UX is an area where it could be improved.
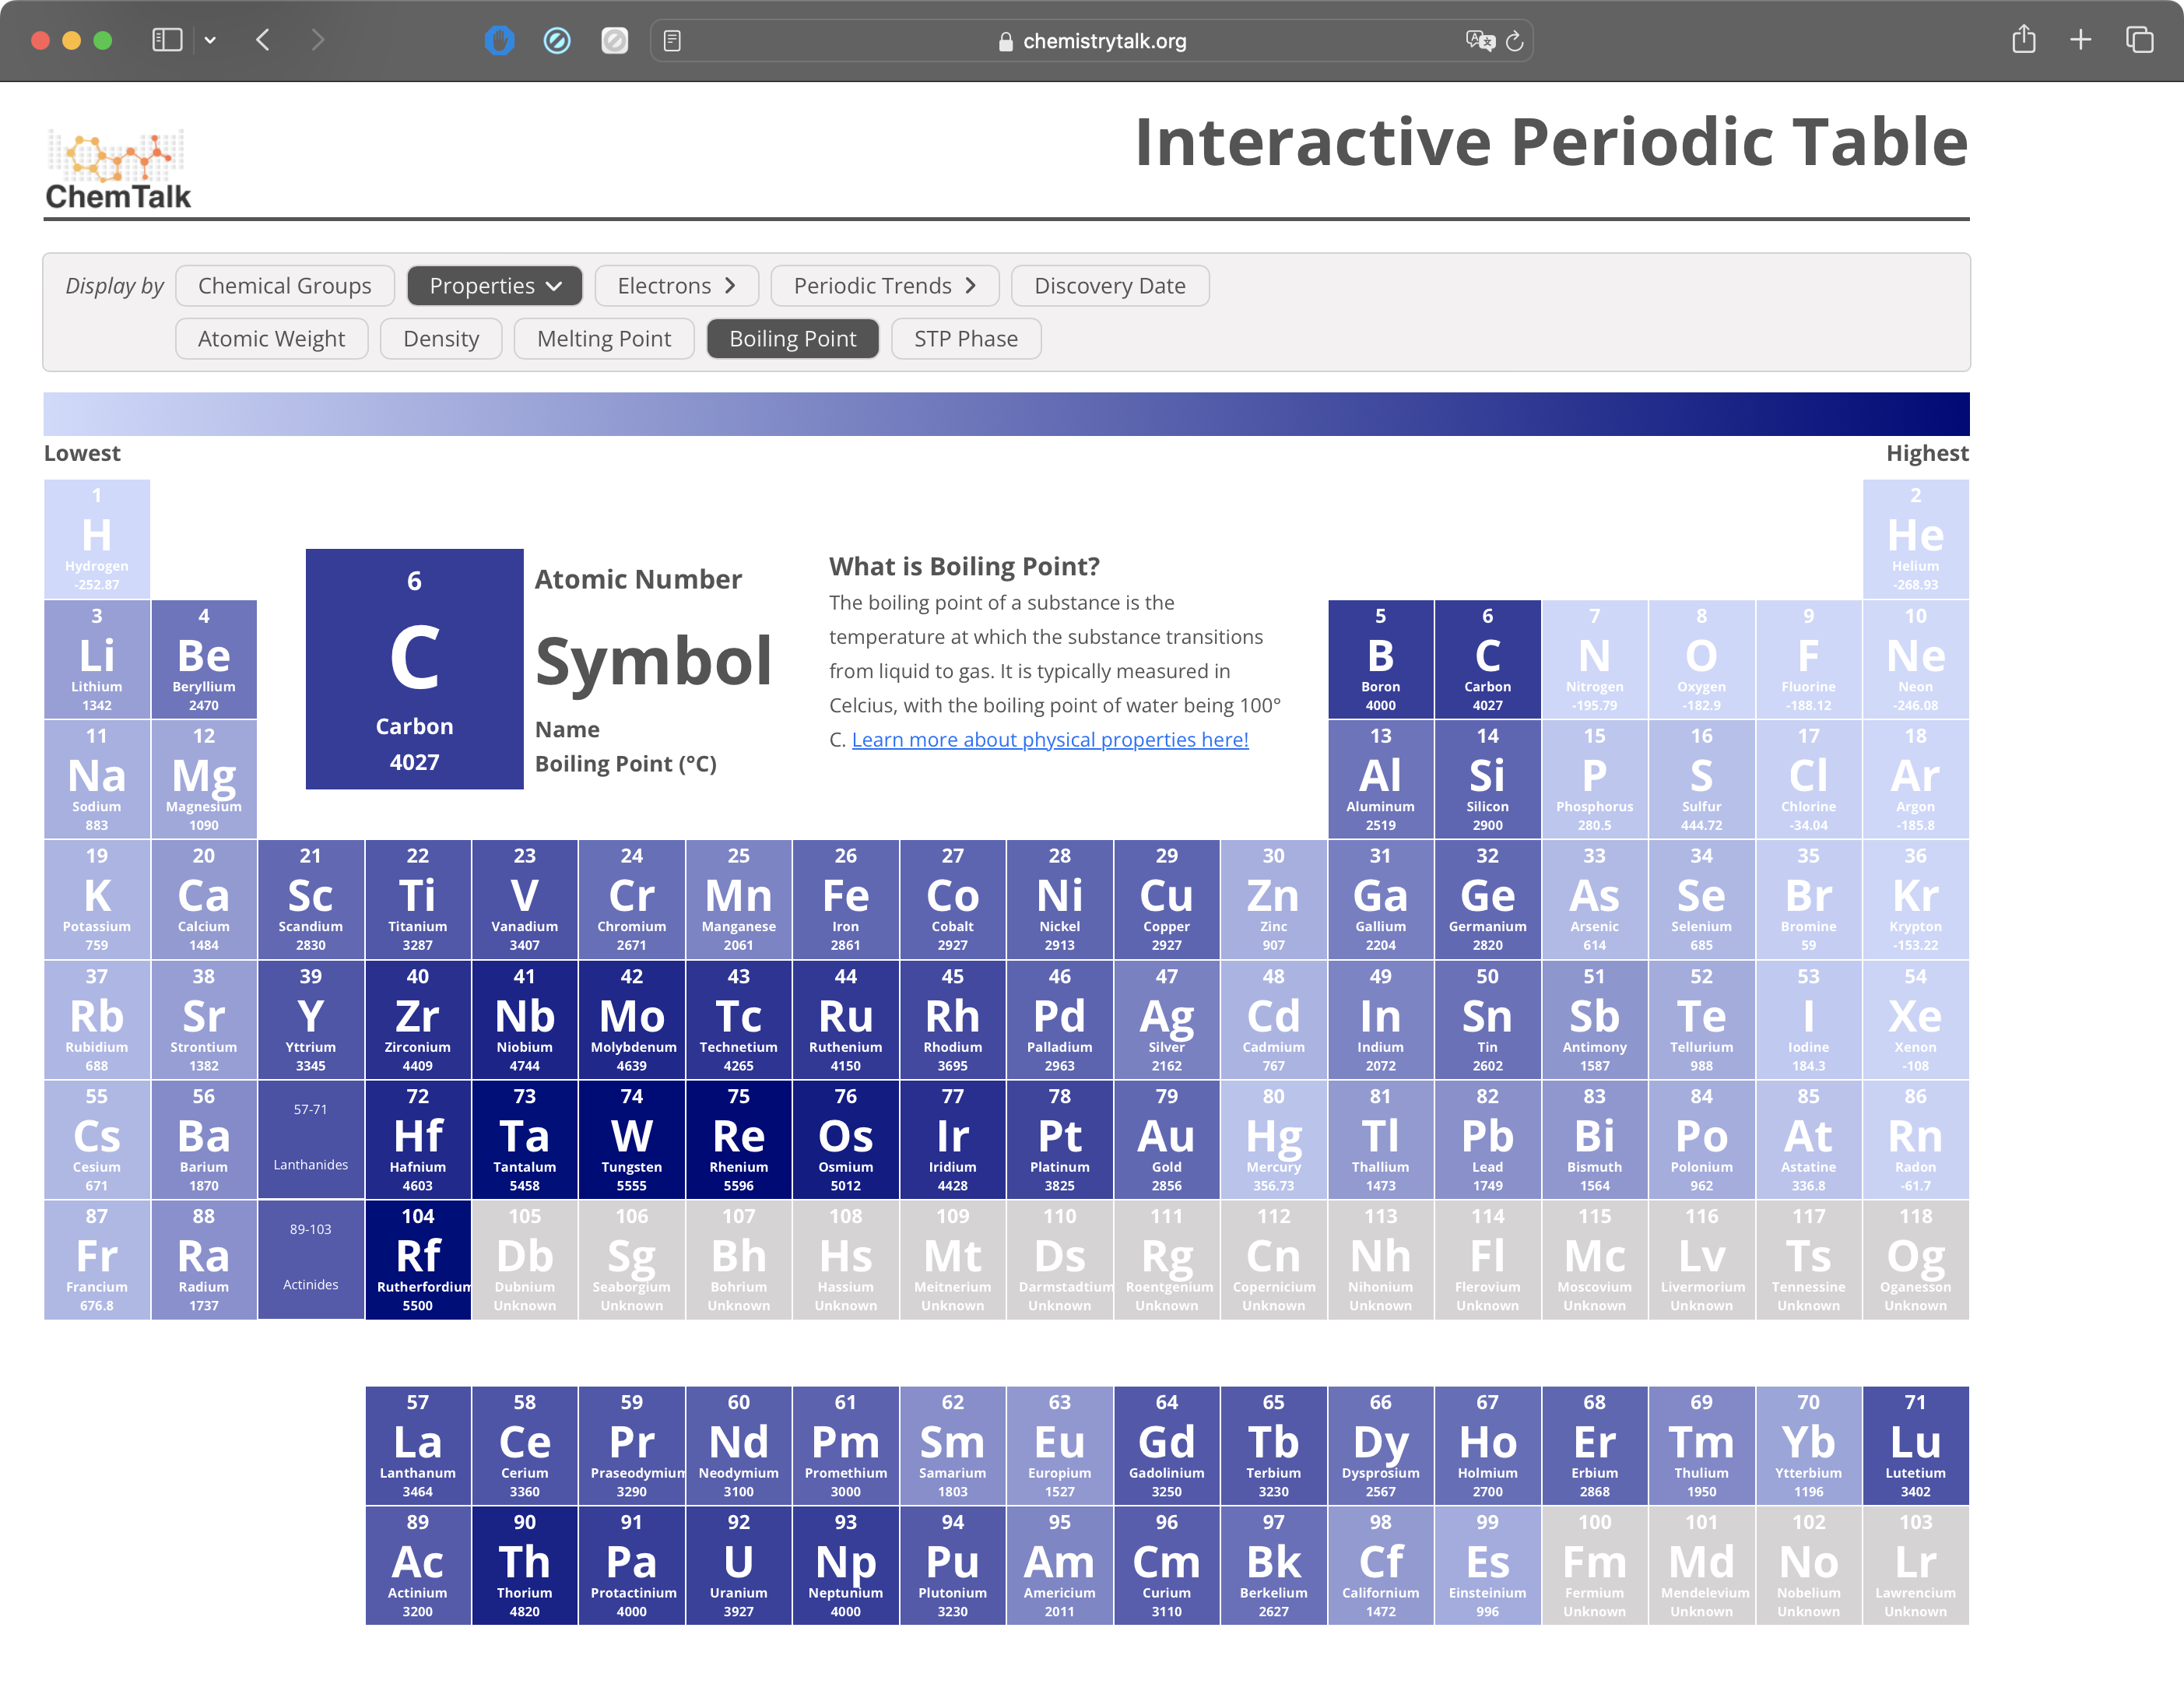
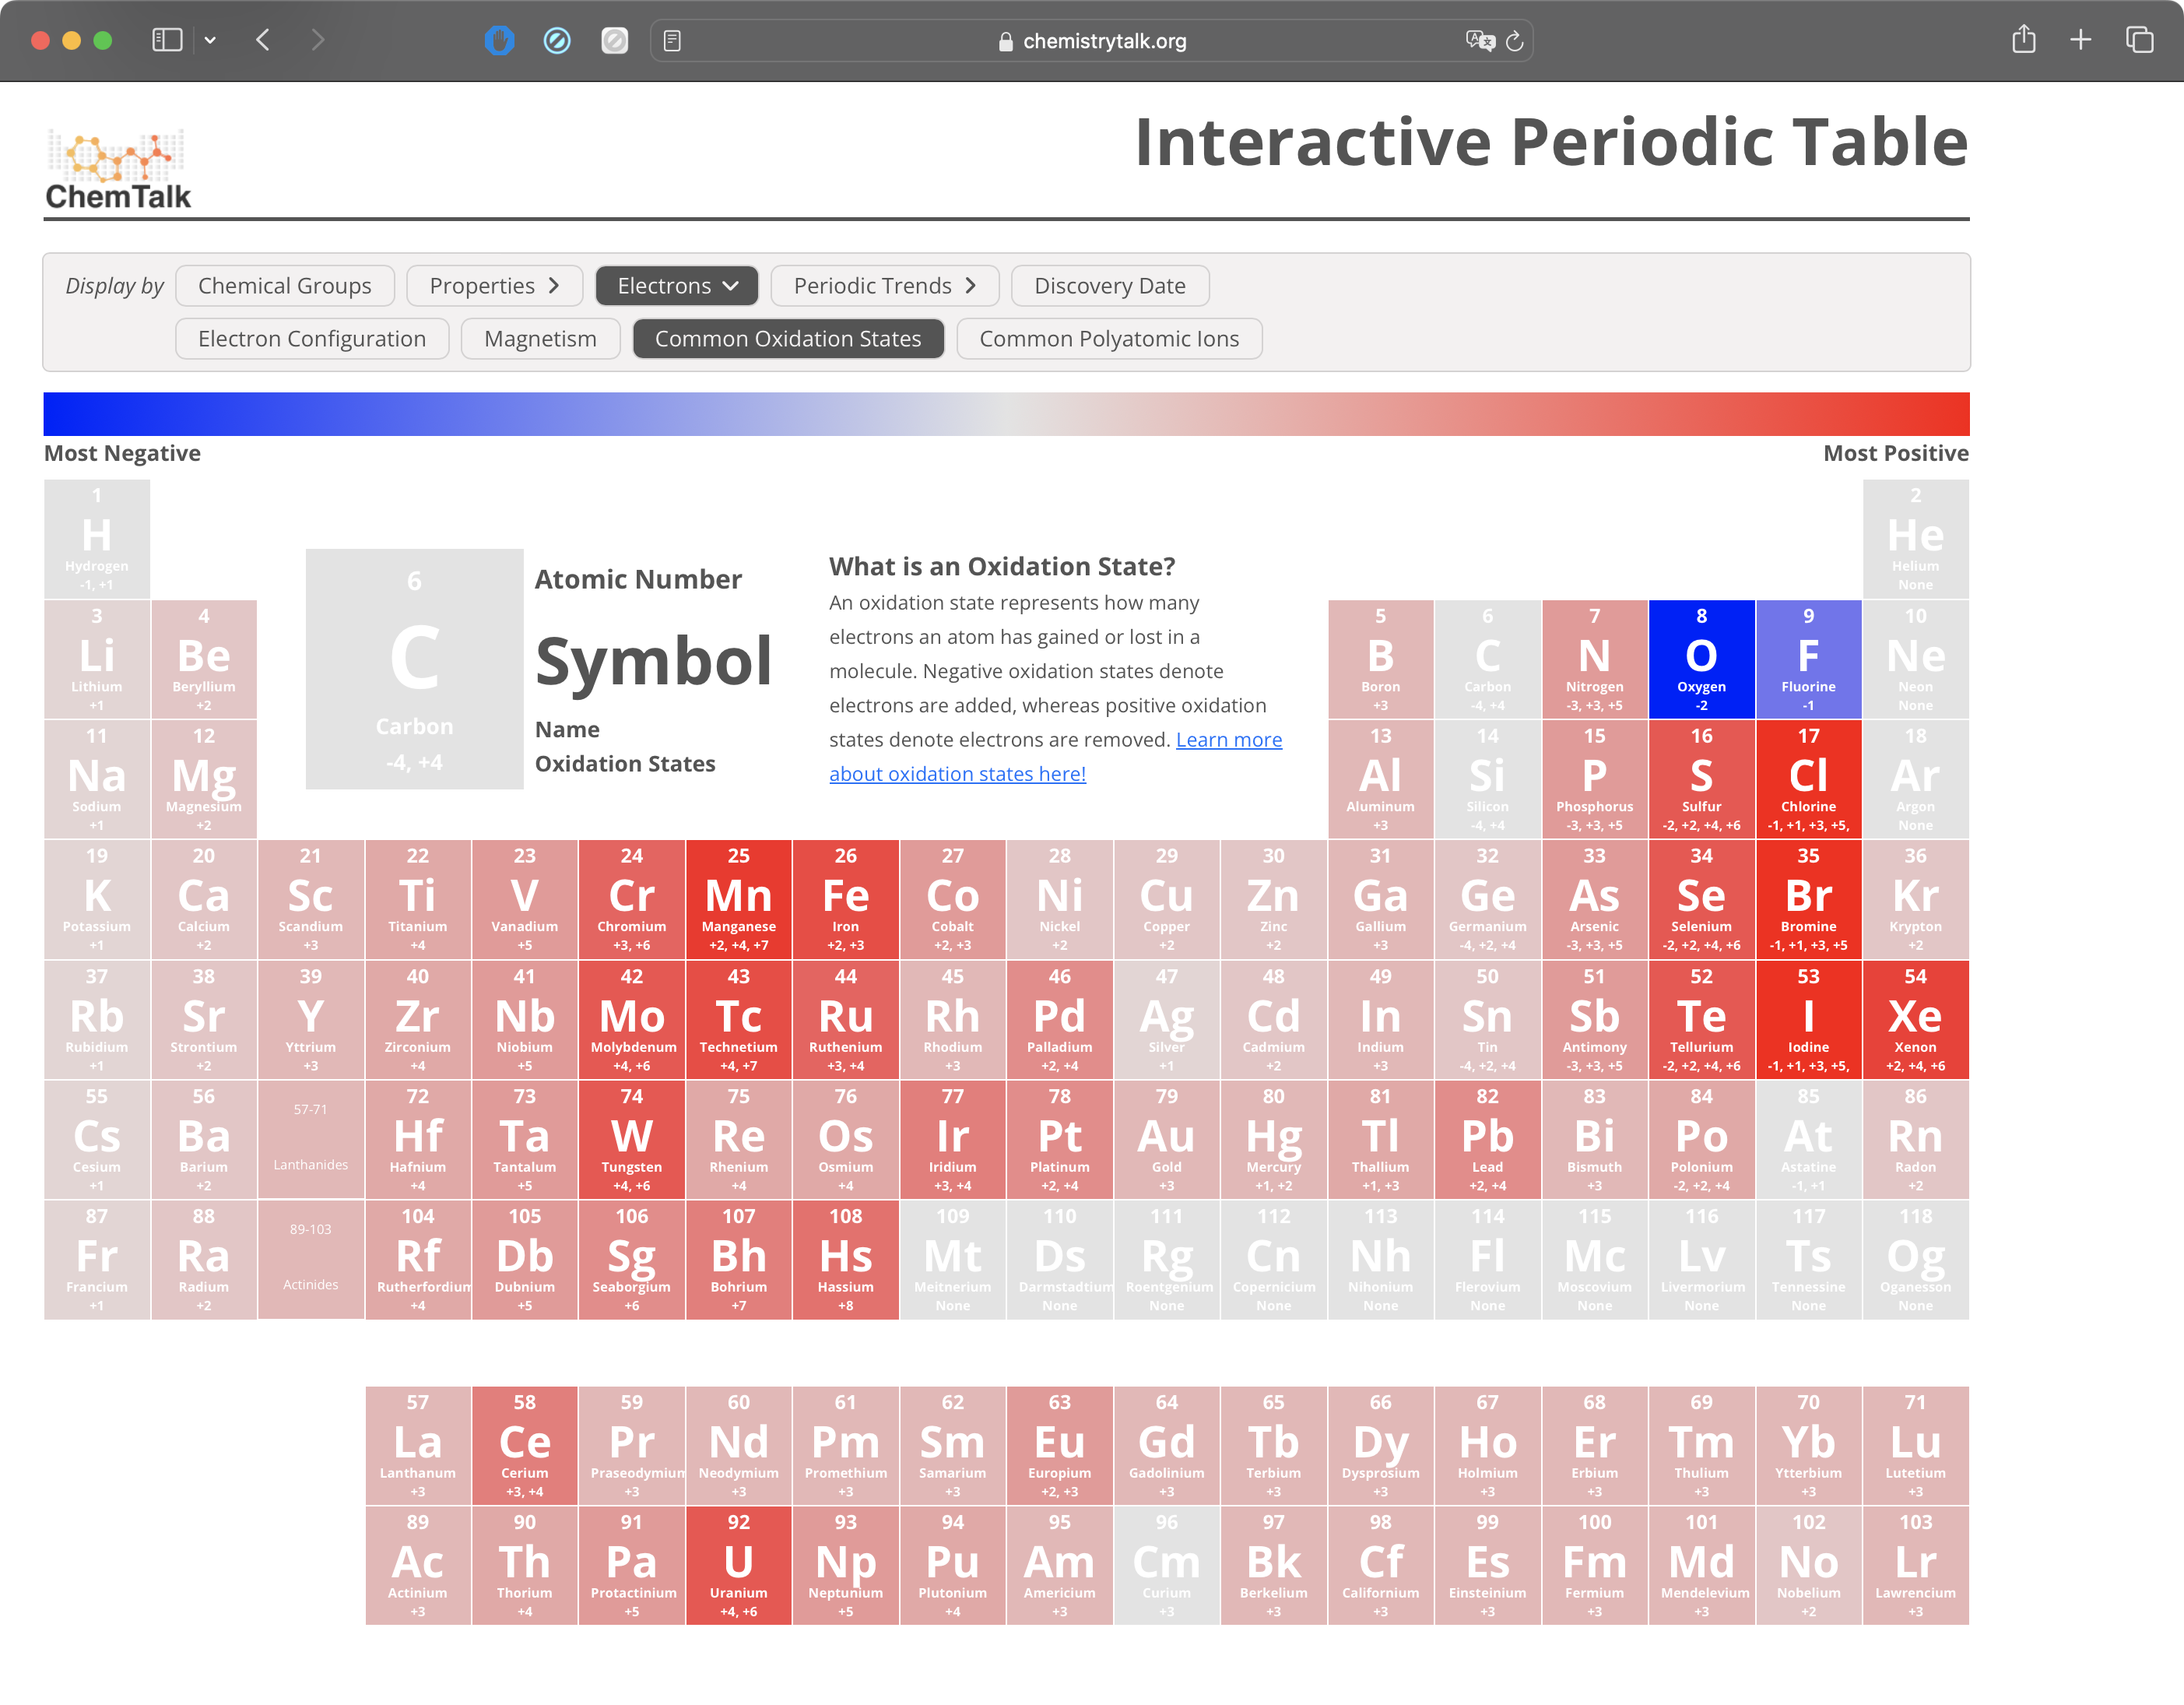
To improve on PTable's design, I implemented a selector section at the top that allows users to quickly get aggregated information about all the elements at once. For example, users can click on boiling point to see the boiling point values on every element square, as well as visualizing the differences in boiling points with a color gradient. This allows users to quickly see which elements have high boiling points and which have low boiling points.


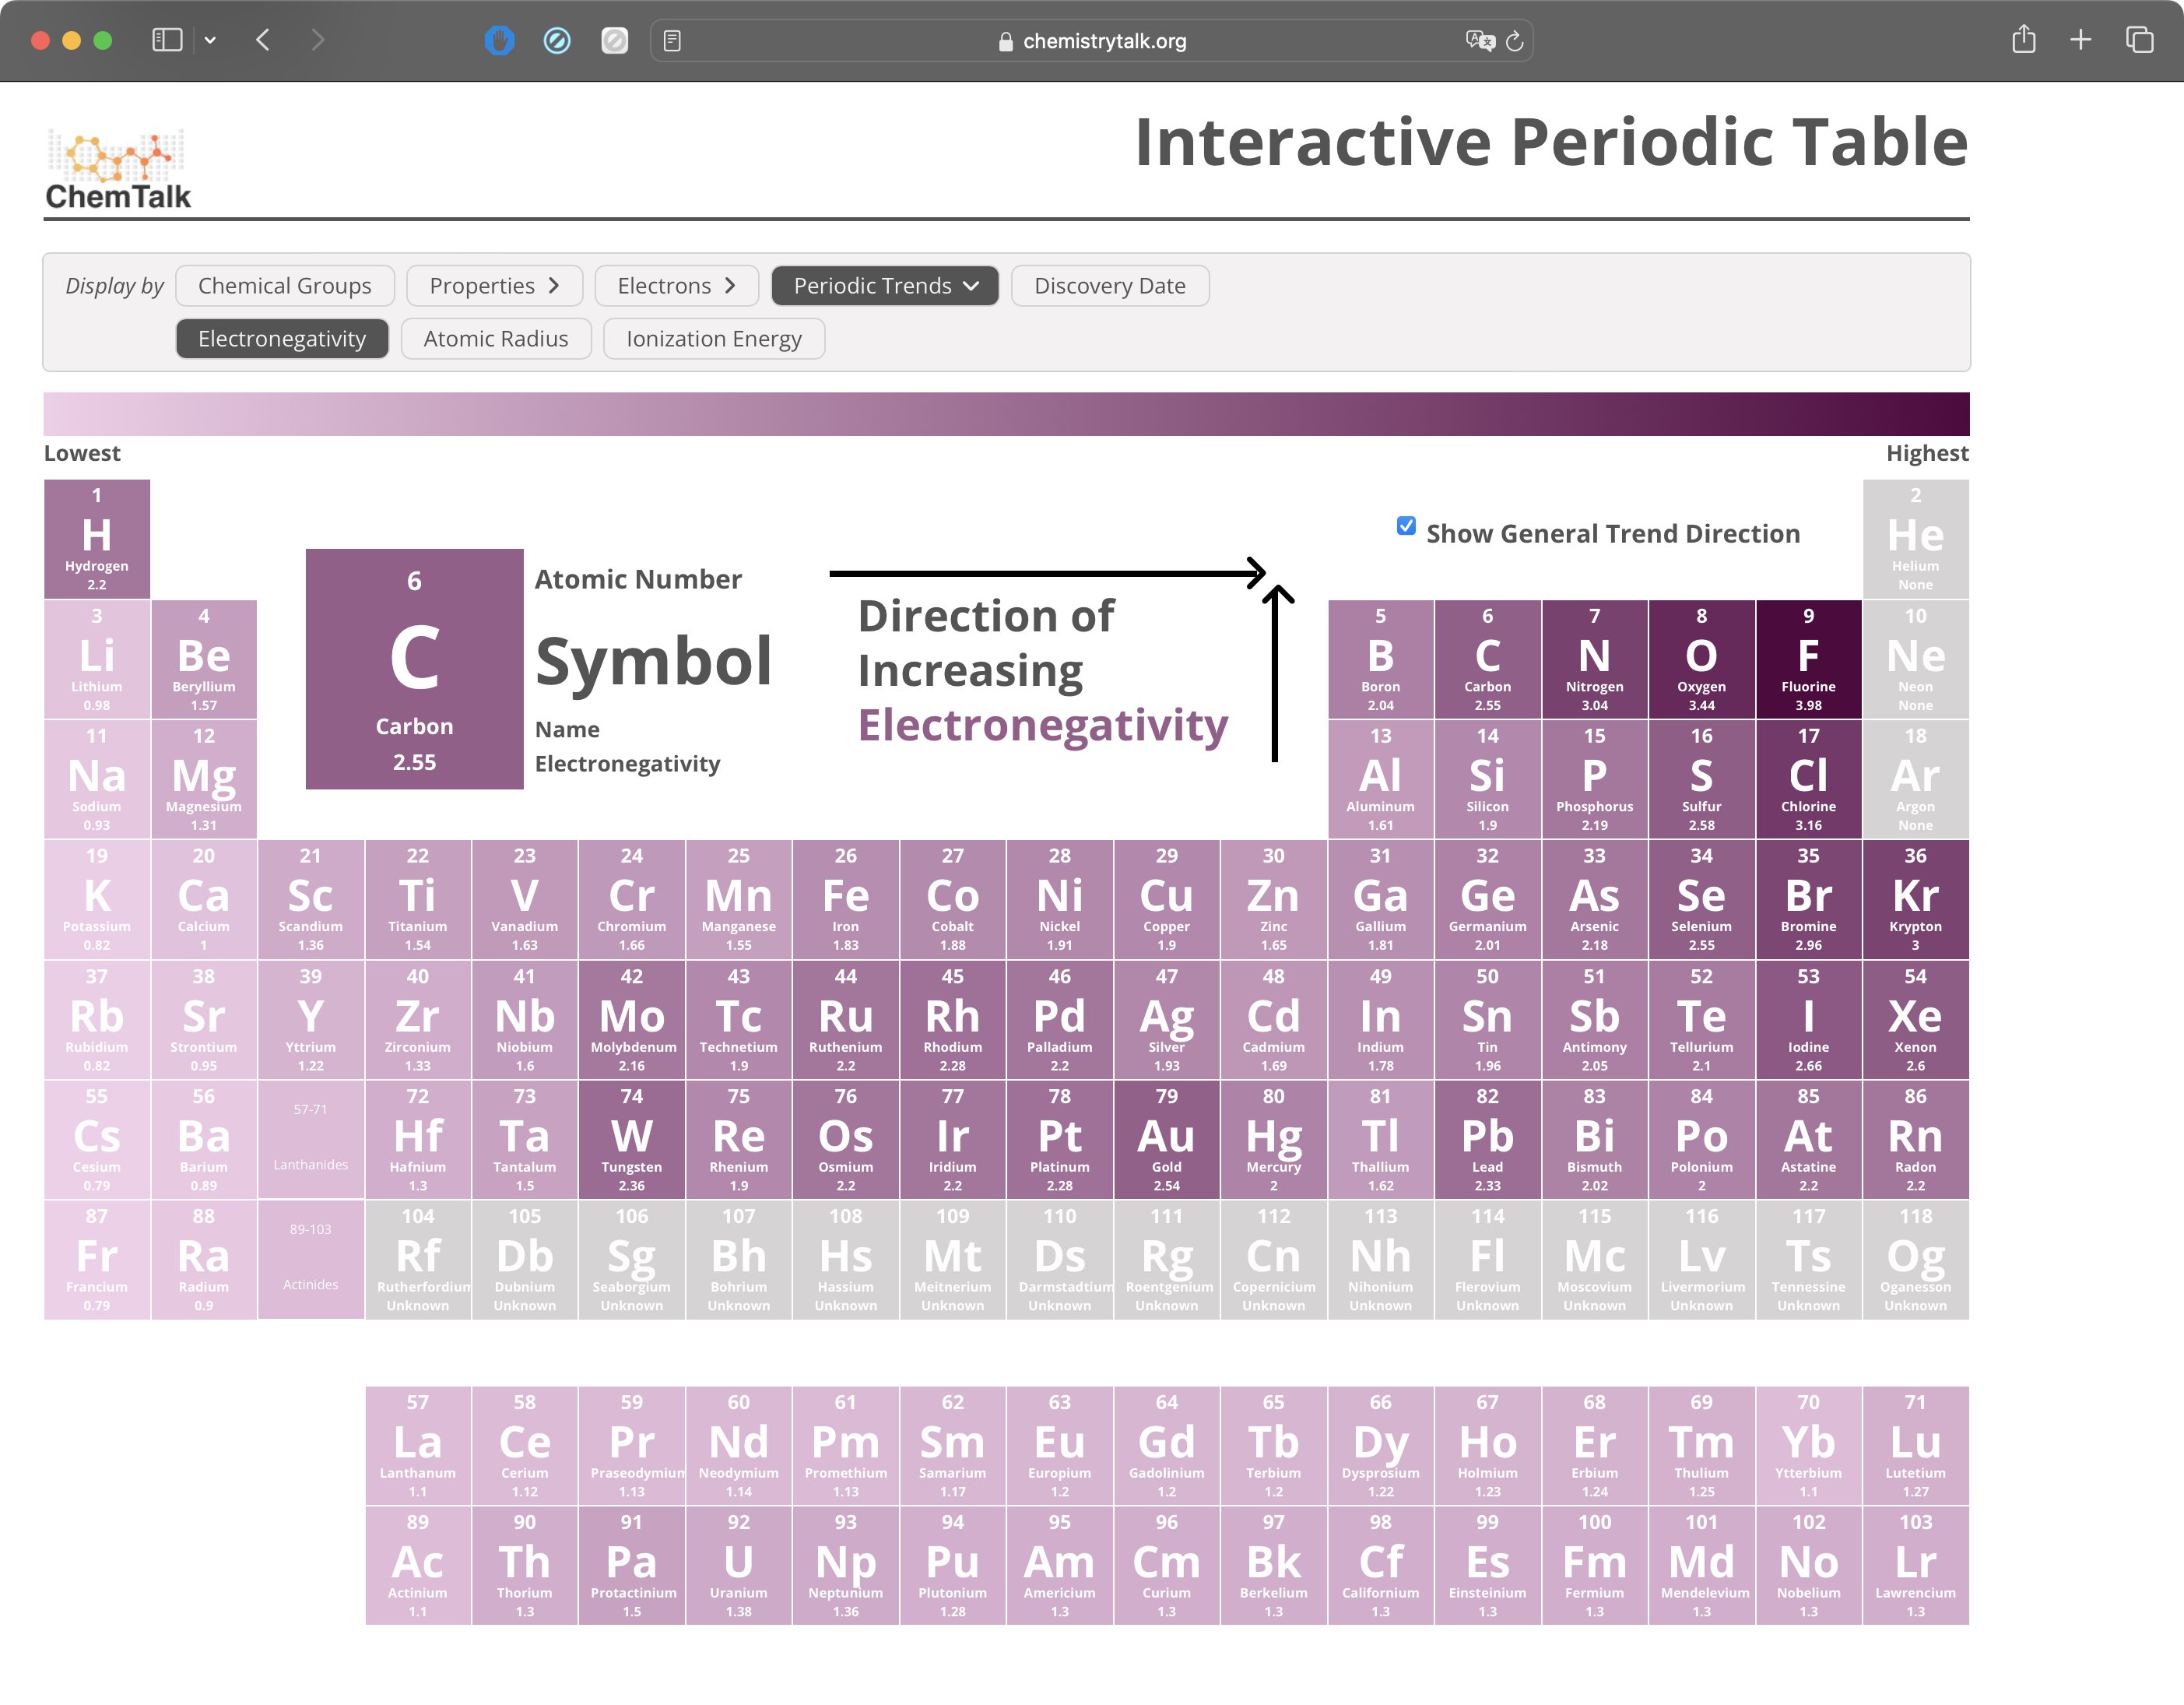
The other aspect of the periodic table that I really wanted to display was the periodic trends. For example, it is commonly taught that electronegativity and ionization energy increase as you go up and right on the table and atomic radius increases going down and left. I wanted to display these trends in a way that was both intuitive and easy to understand. To do this, I created a section that allows users to select a trend and see it displayed on the table. It also optionally displays arrows to show the direction of the periodic trends.
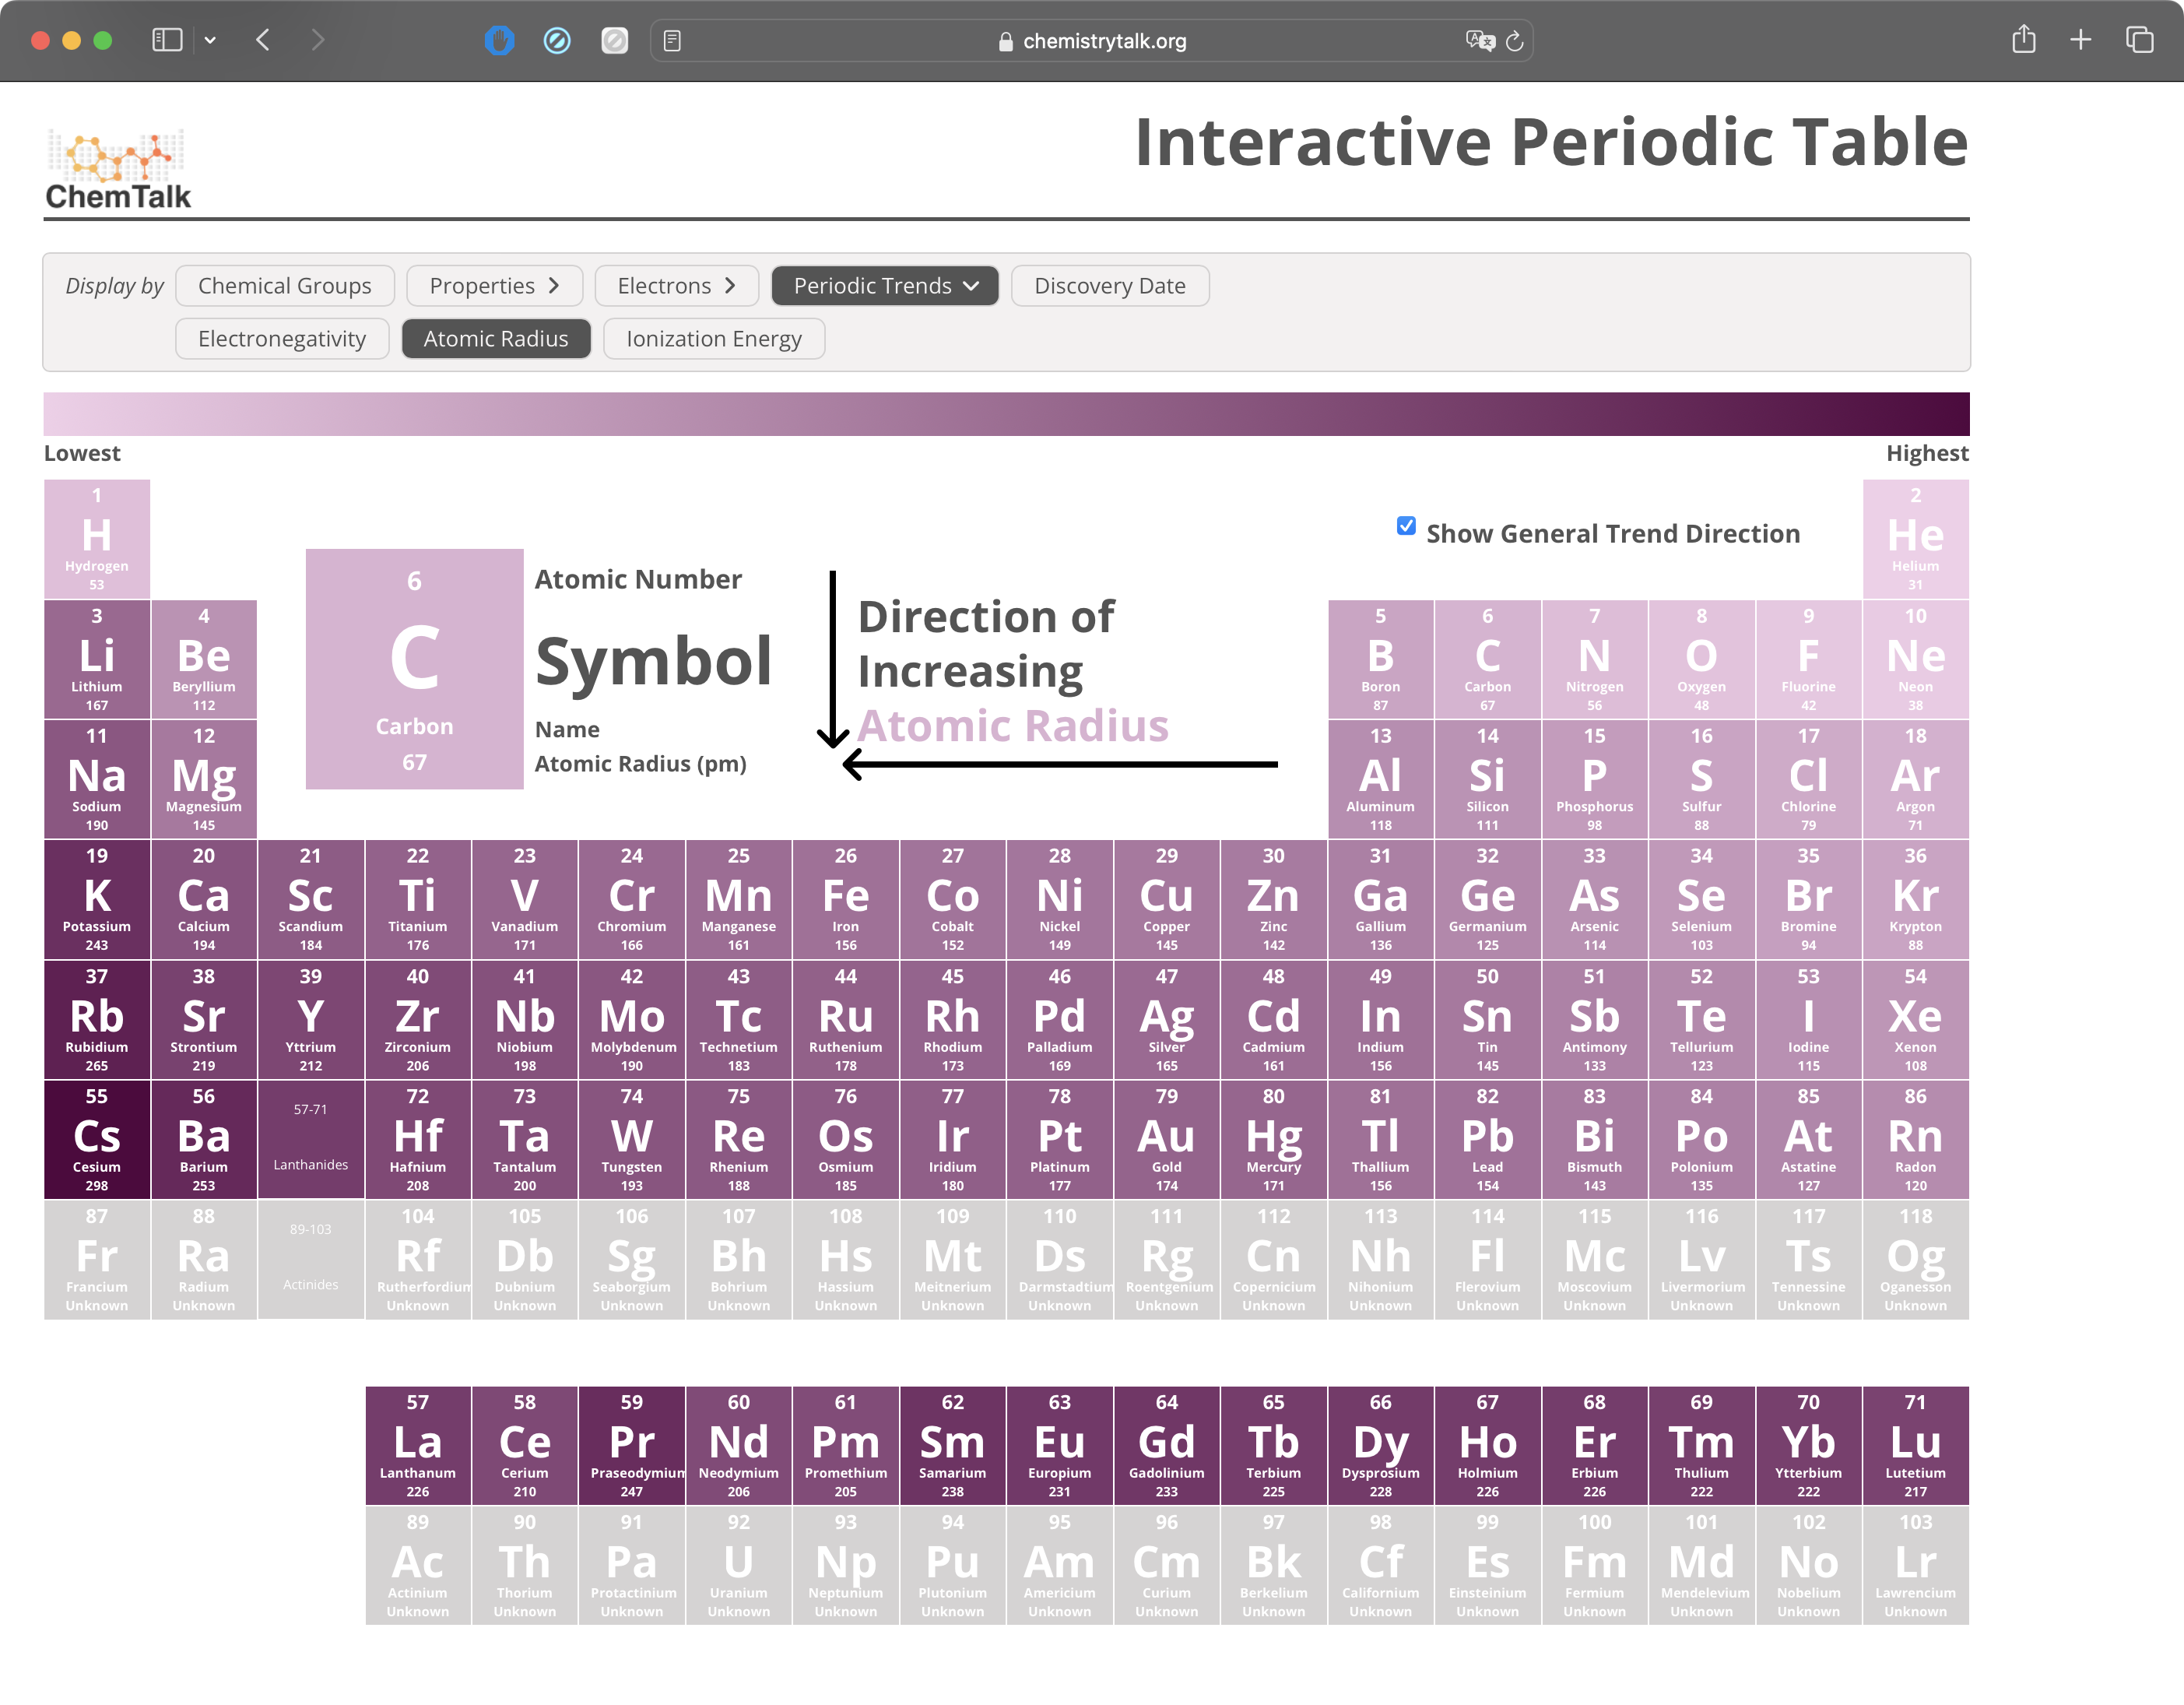
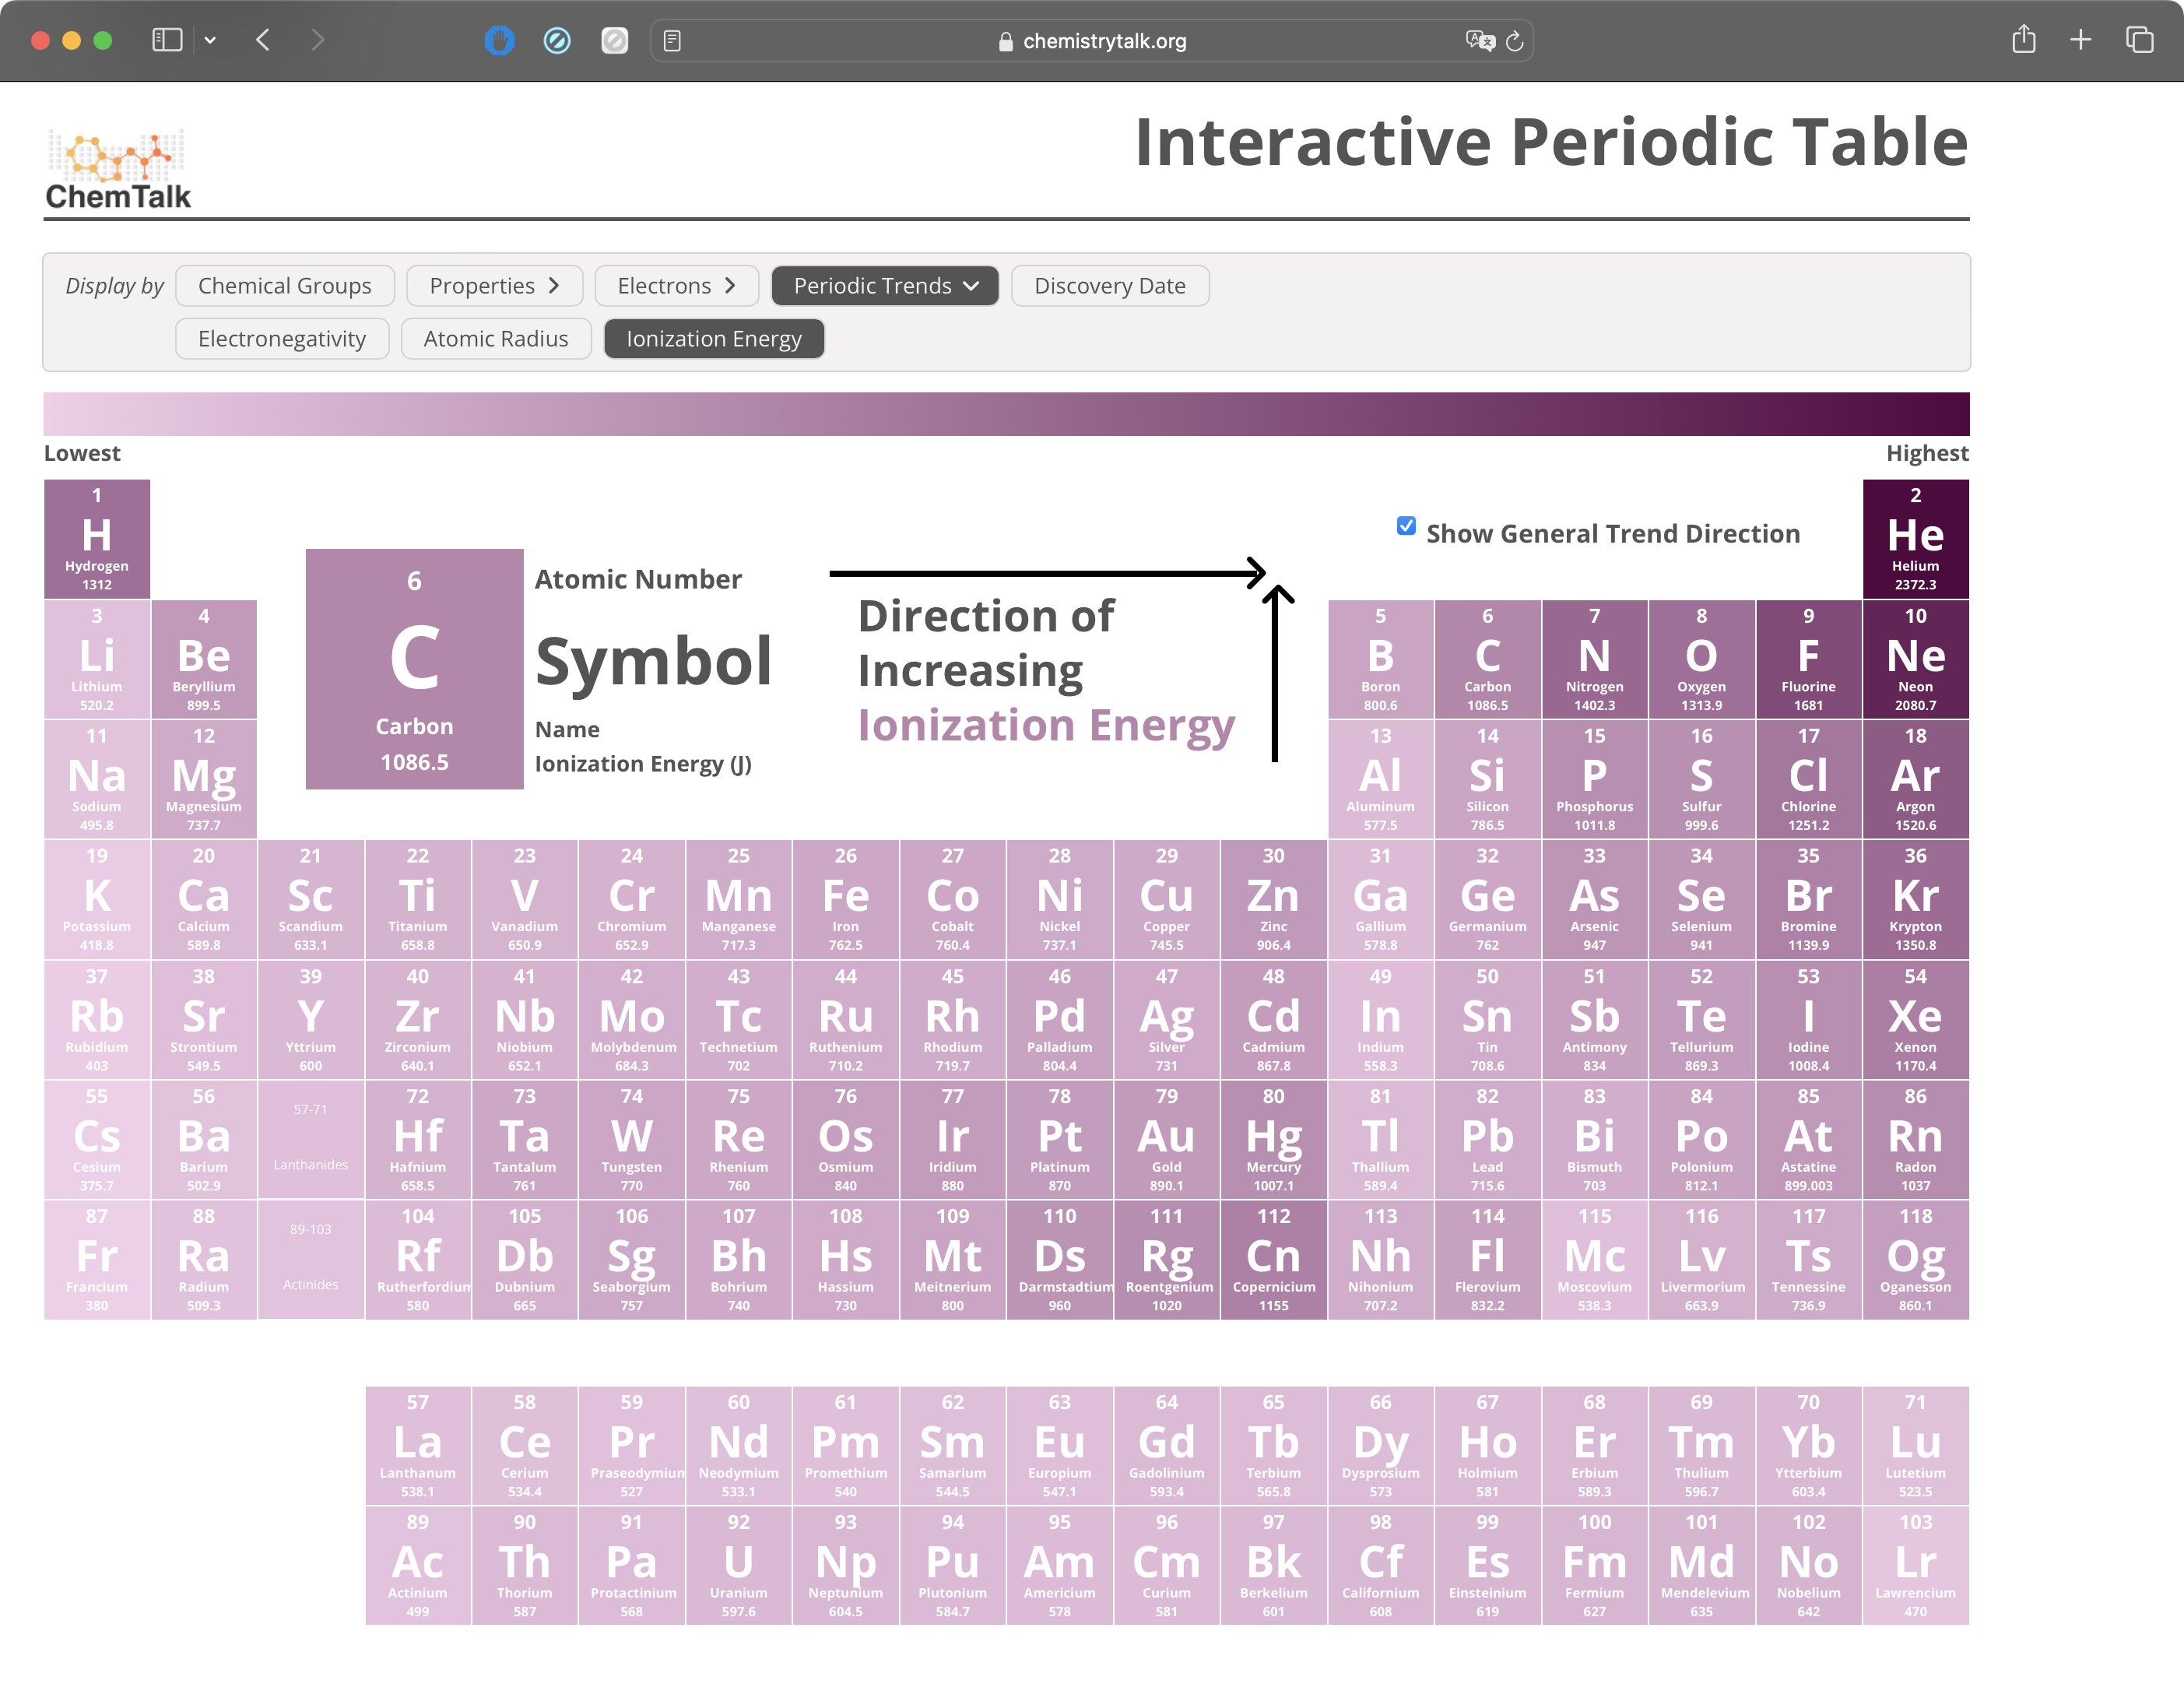
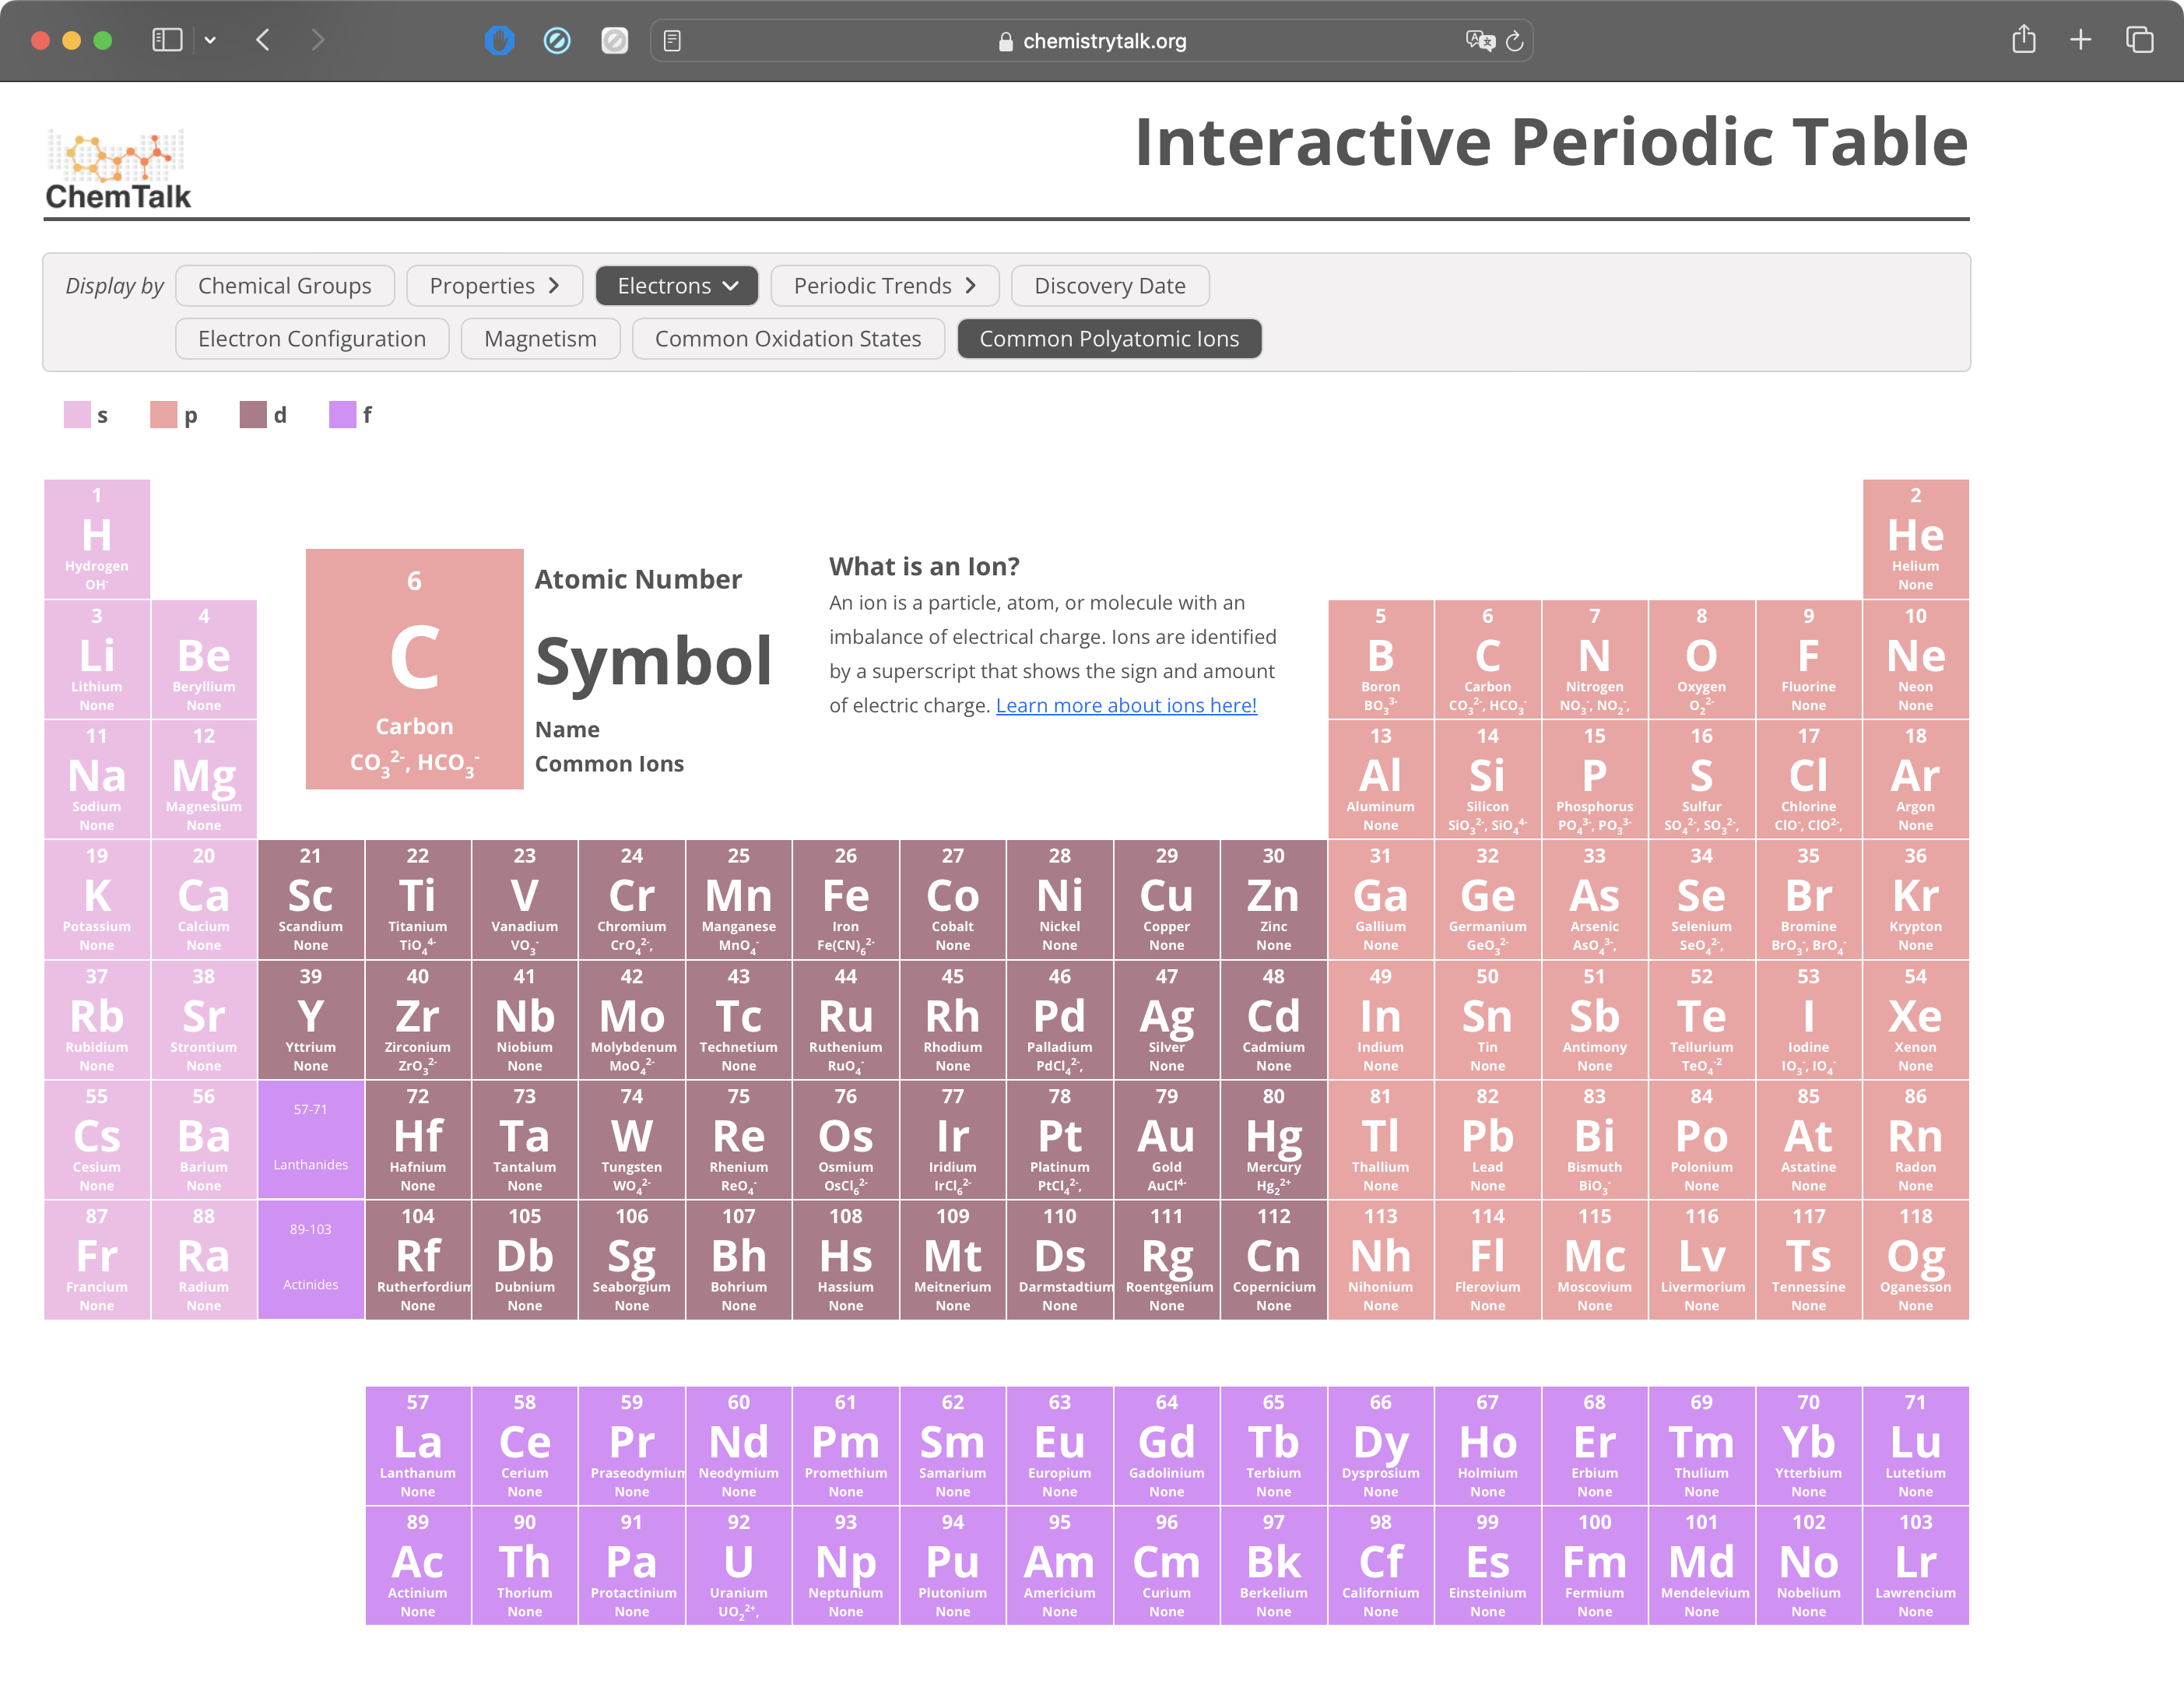
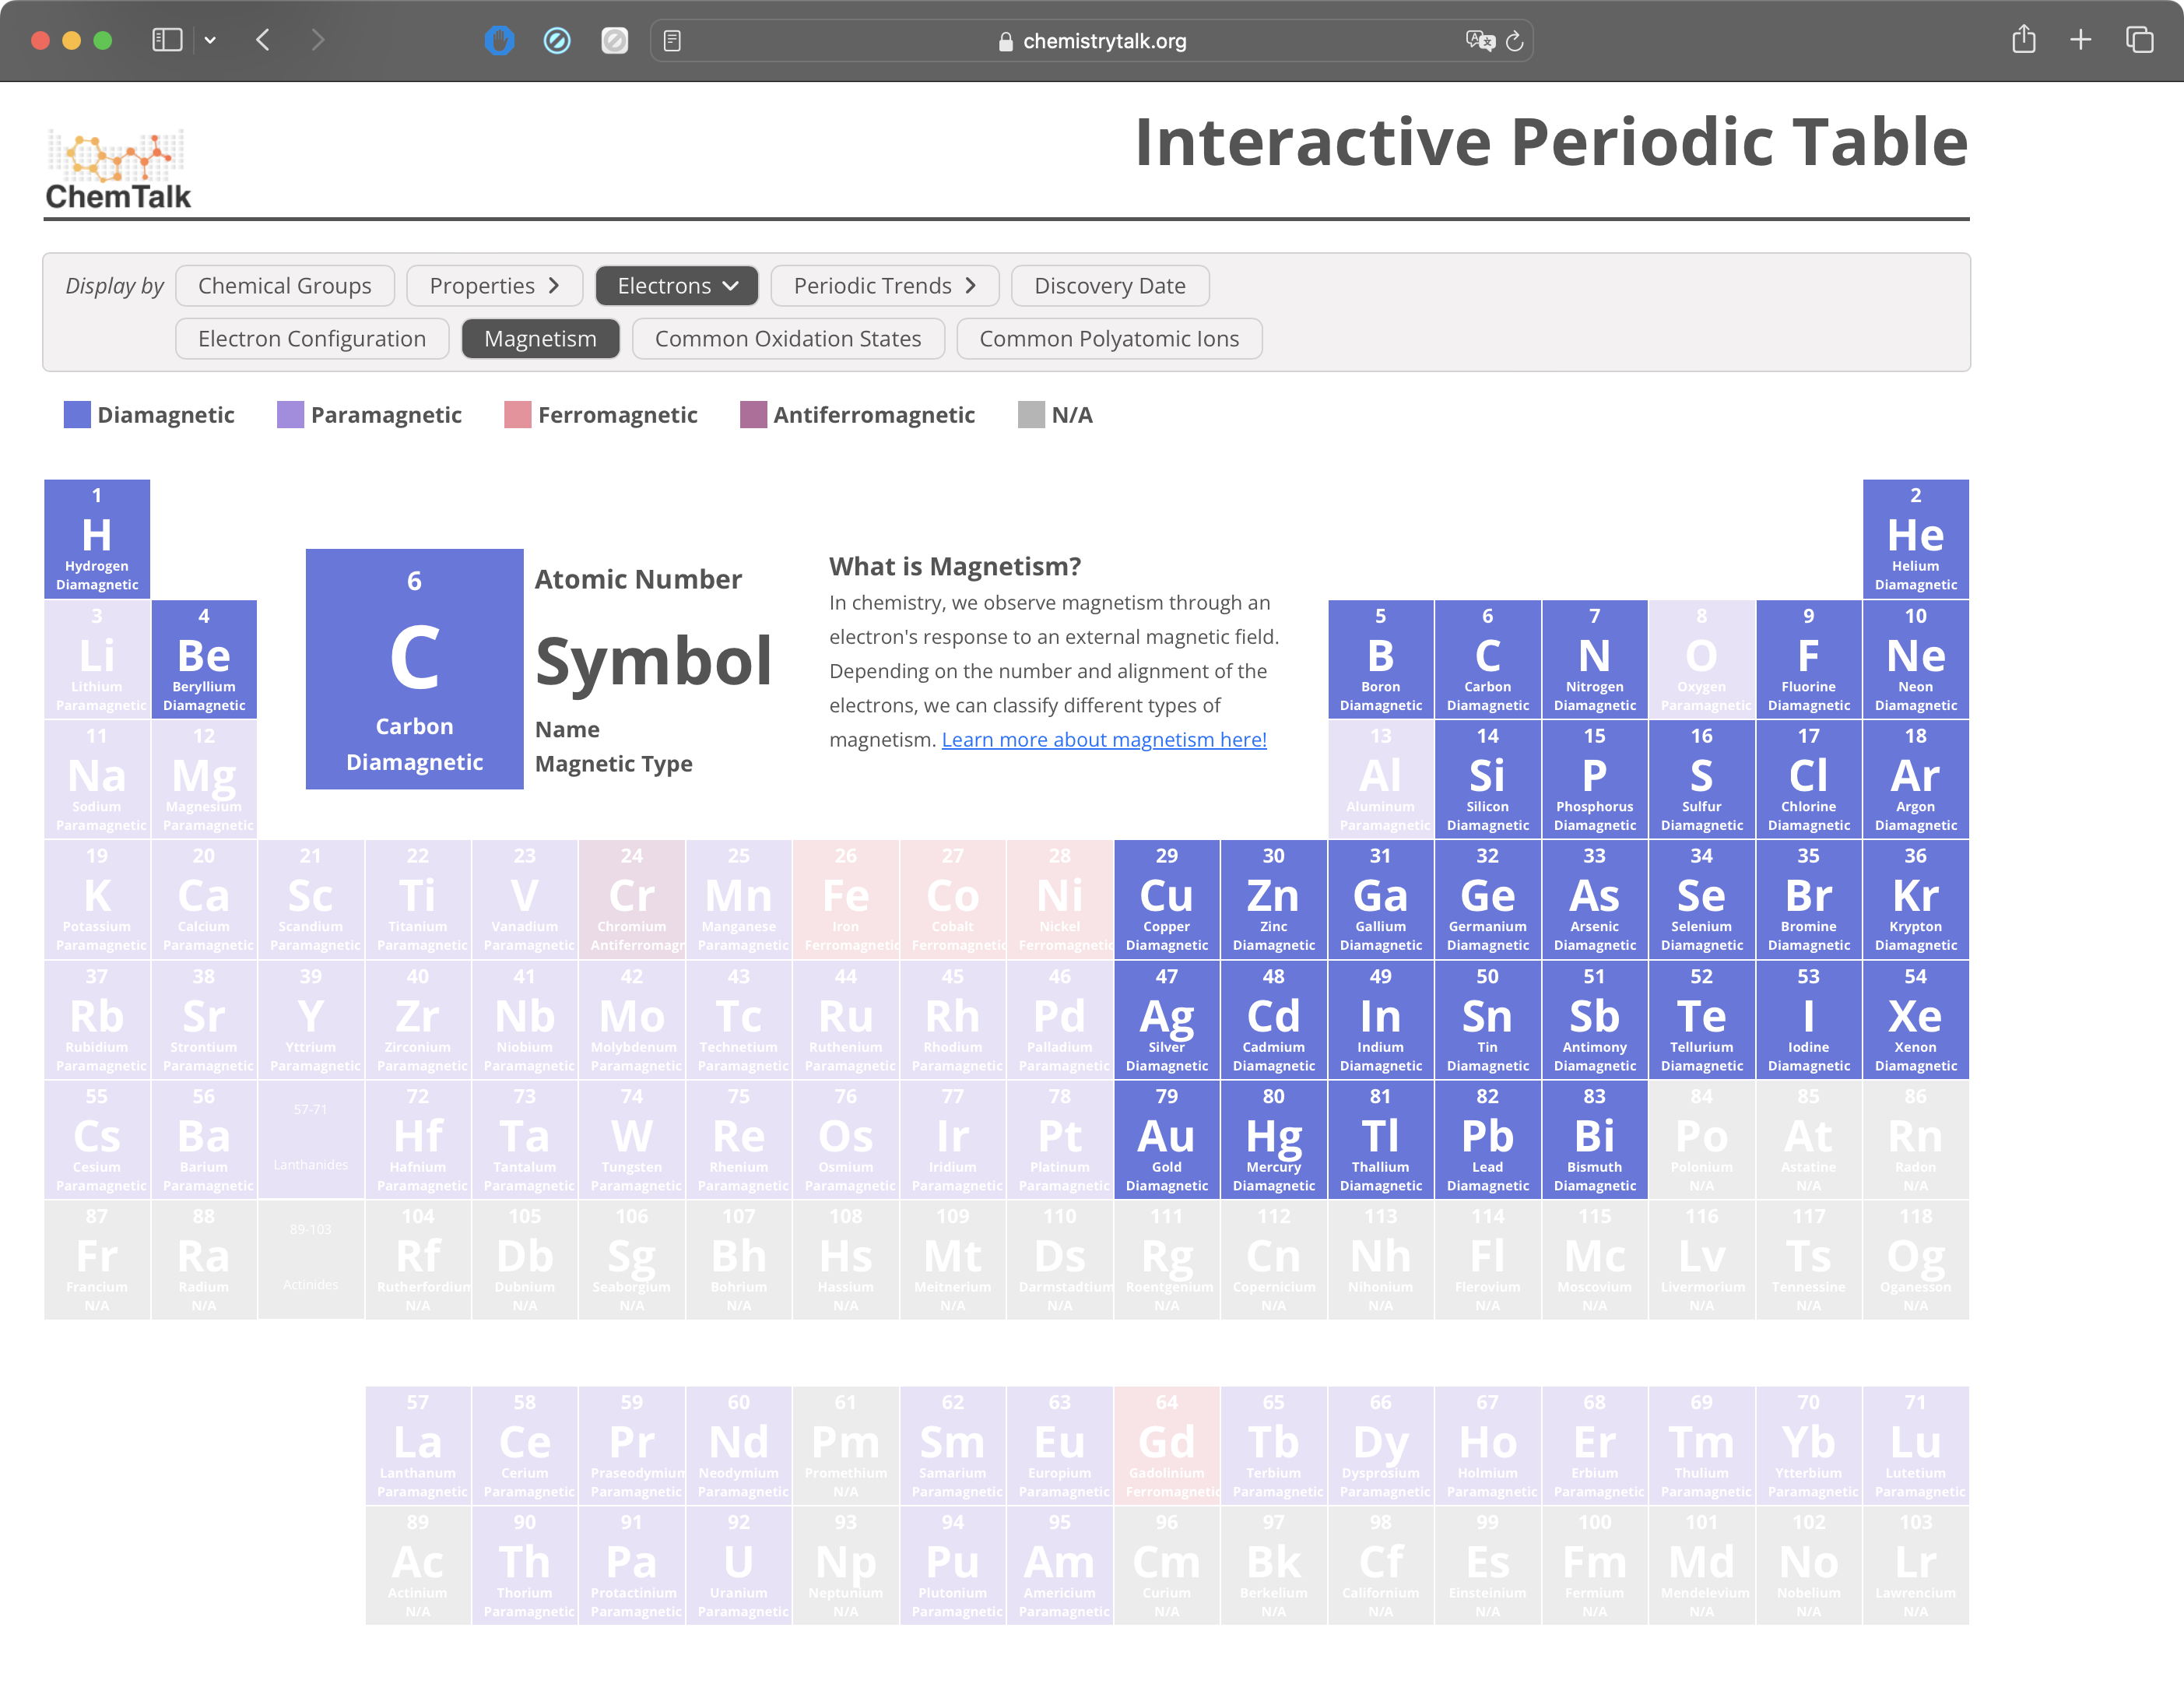
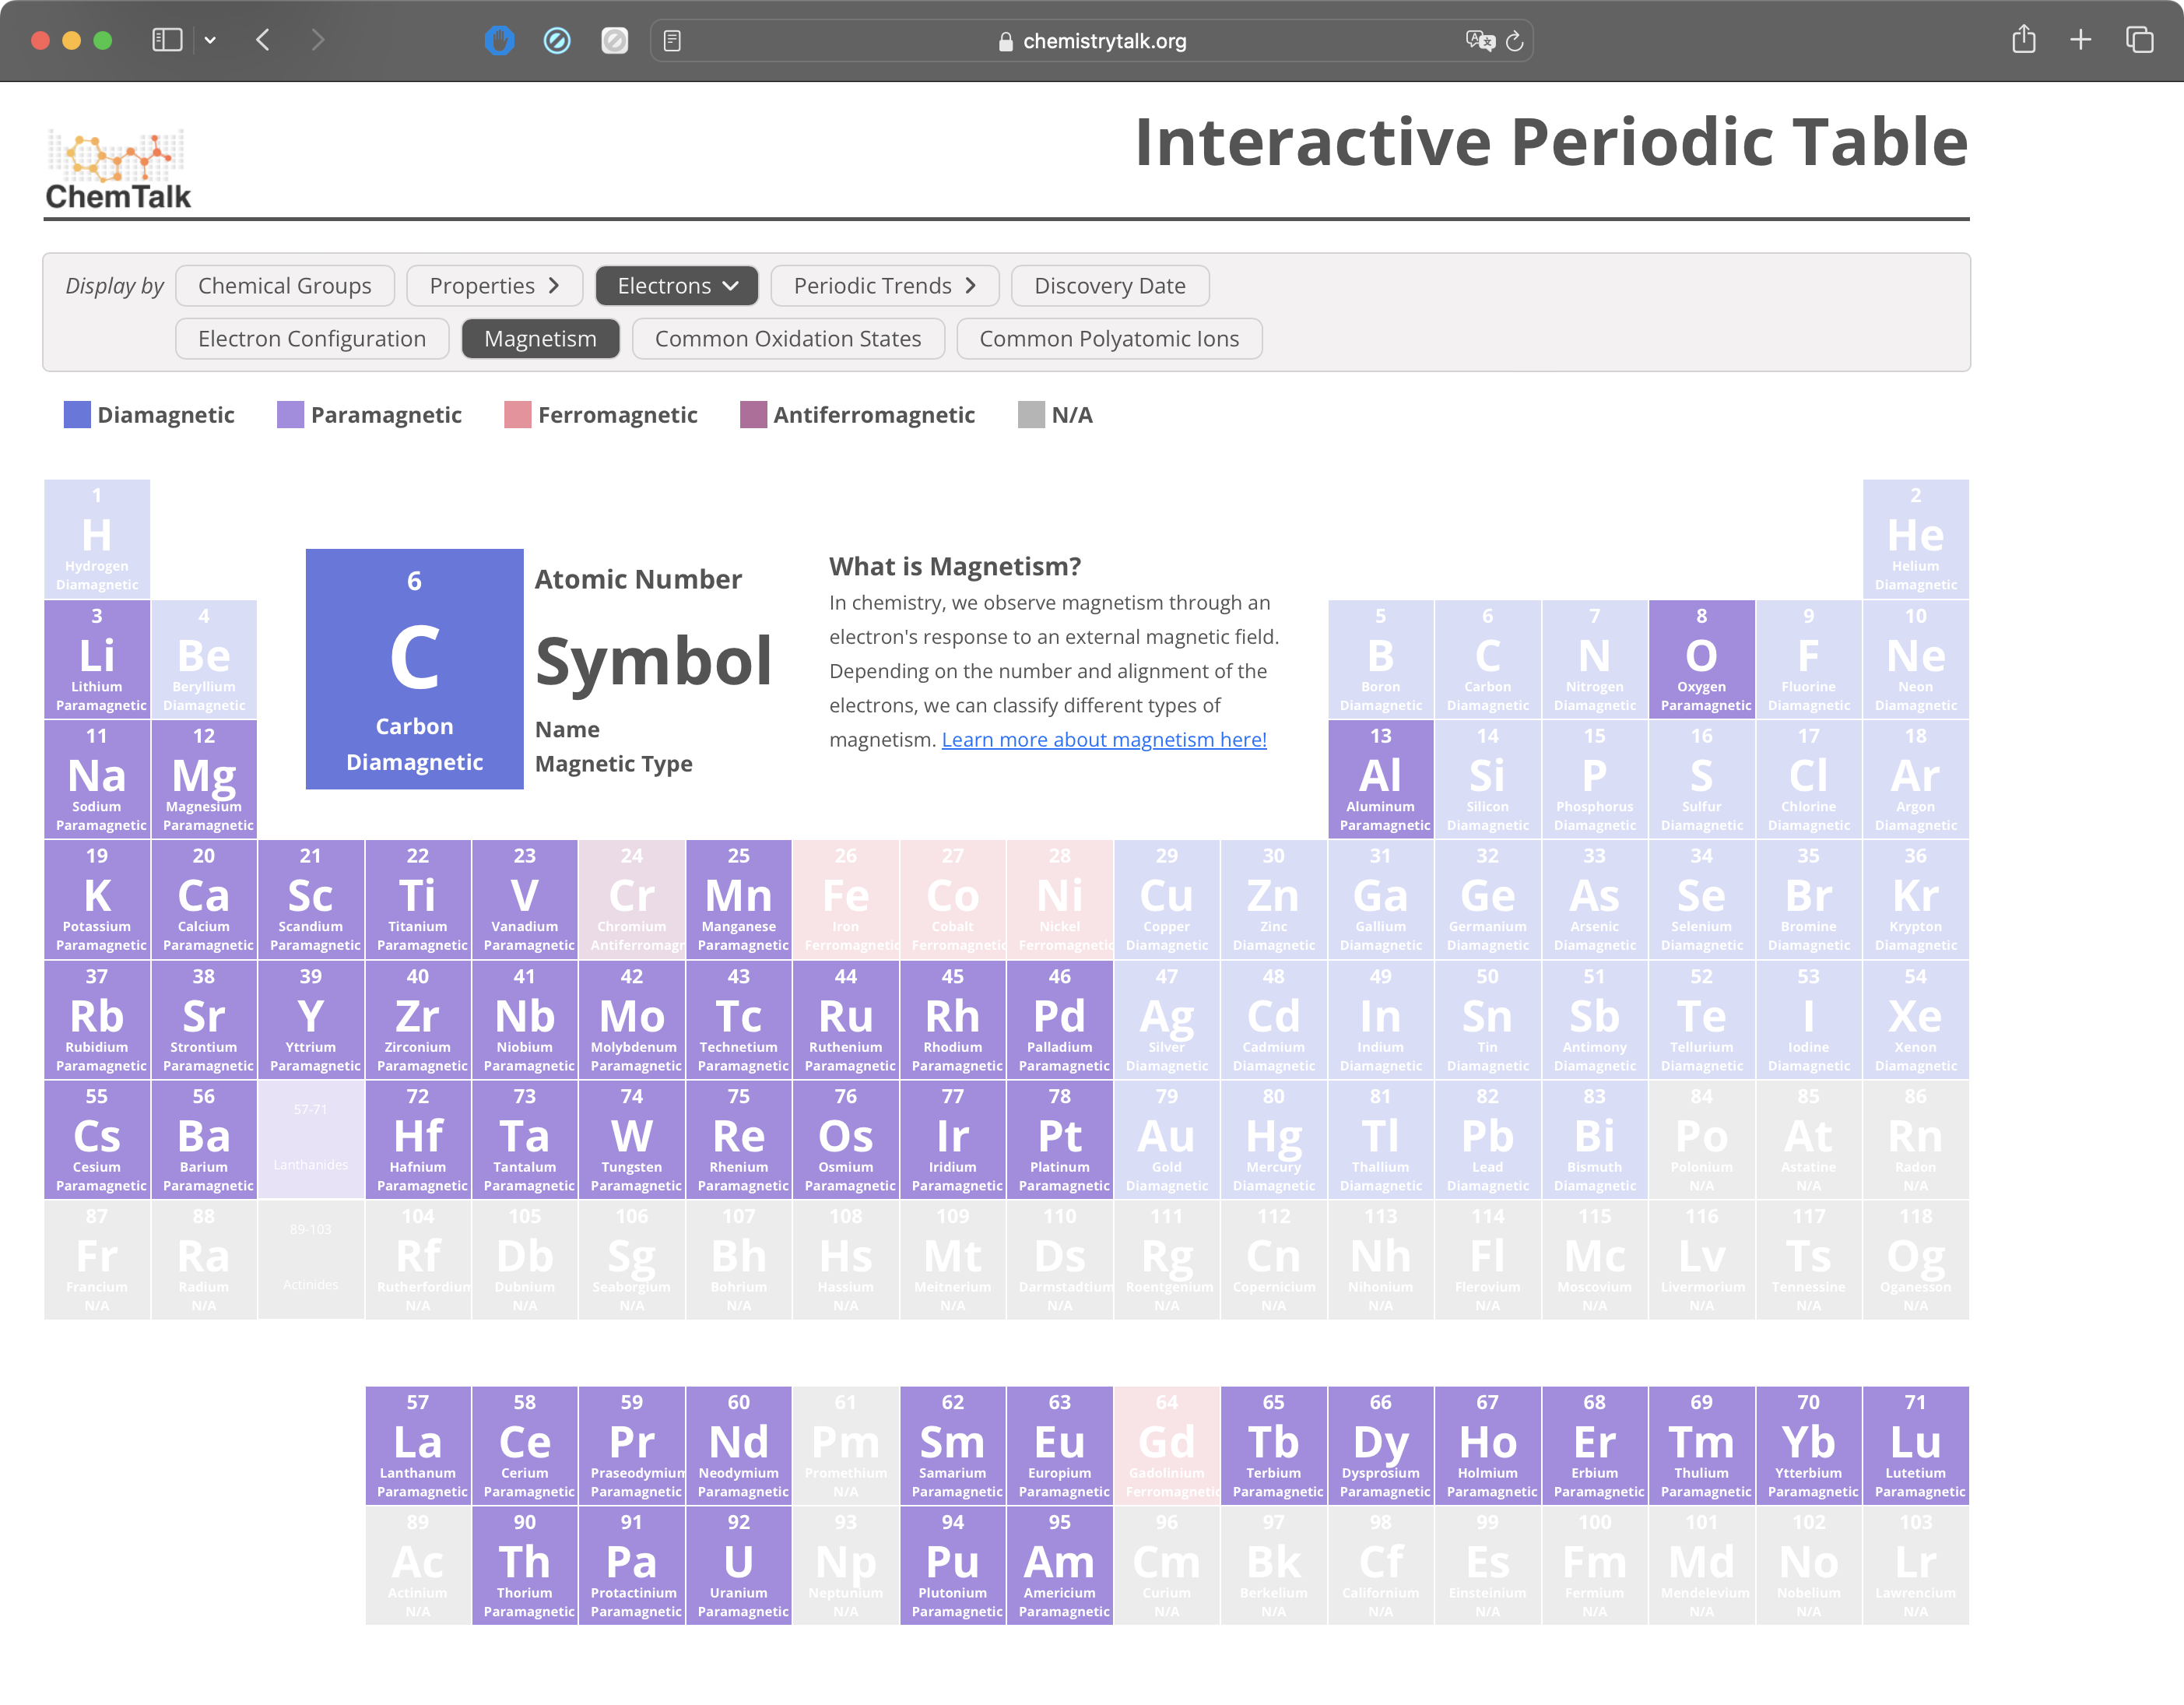
I also wanted to make it easy to see elements with different properties. To do this, I created a section that allows users to select a property and see the elements that have that property highlighted on the table. This allows users to quickly see which elements have similar properties and which elements are outliers. For example, users can select magnetism to see which elements are magnetic, and what type of magnetism they exhibit.
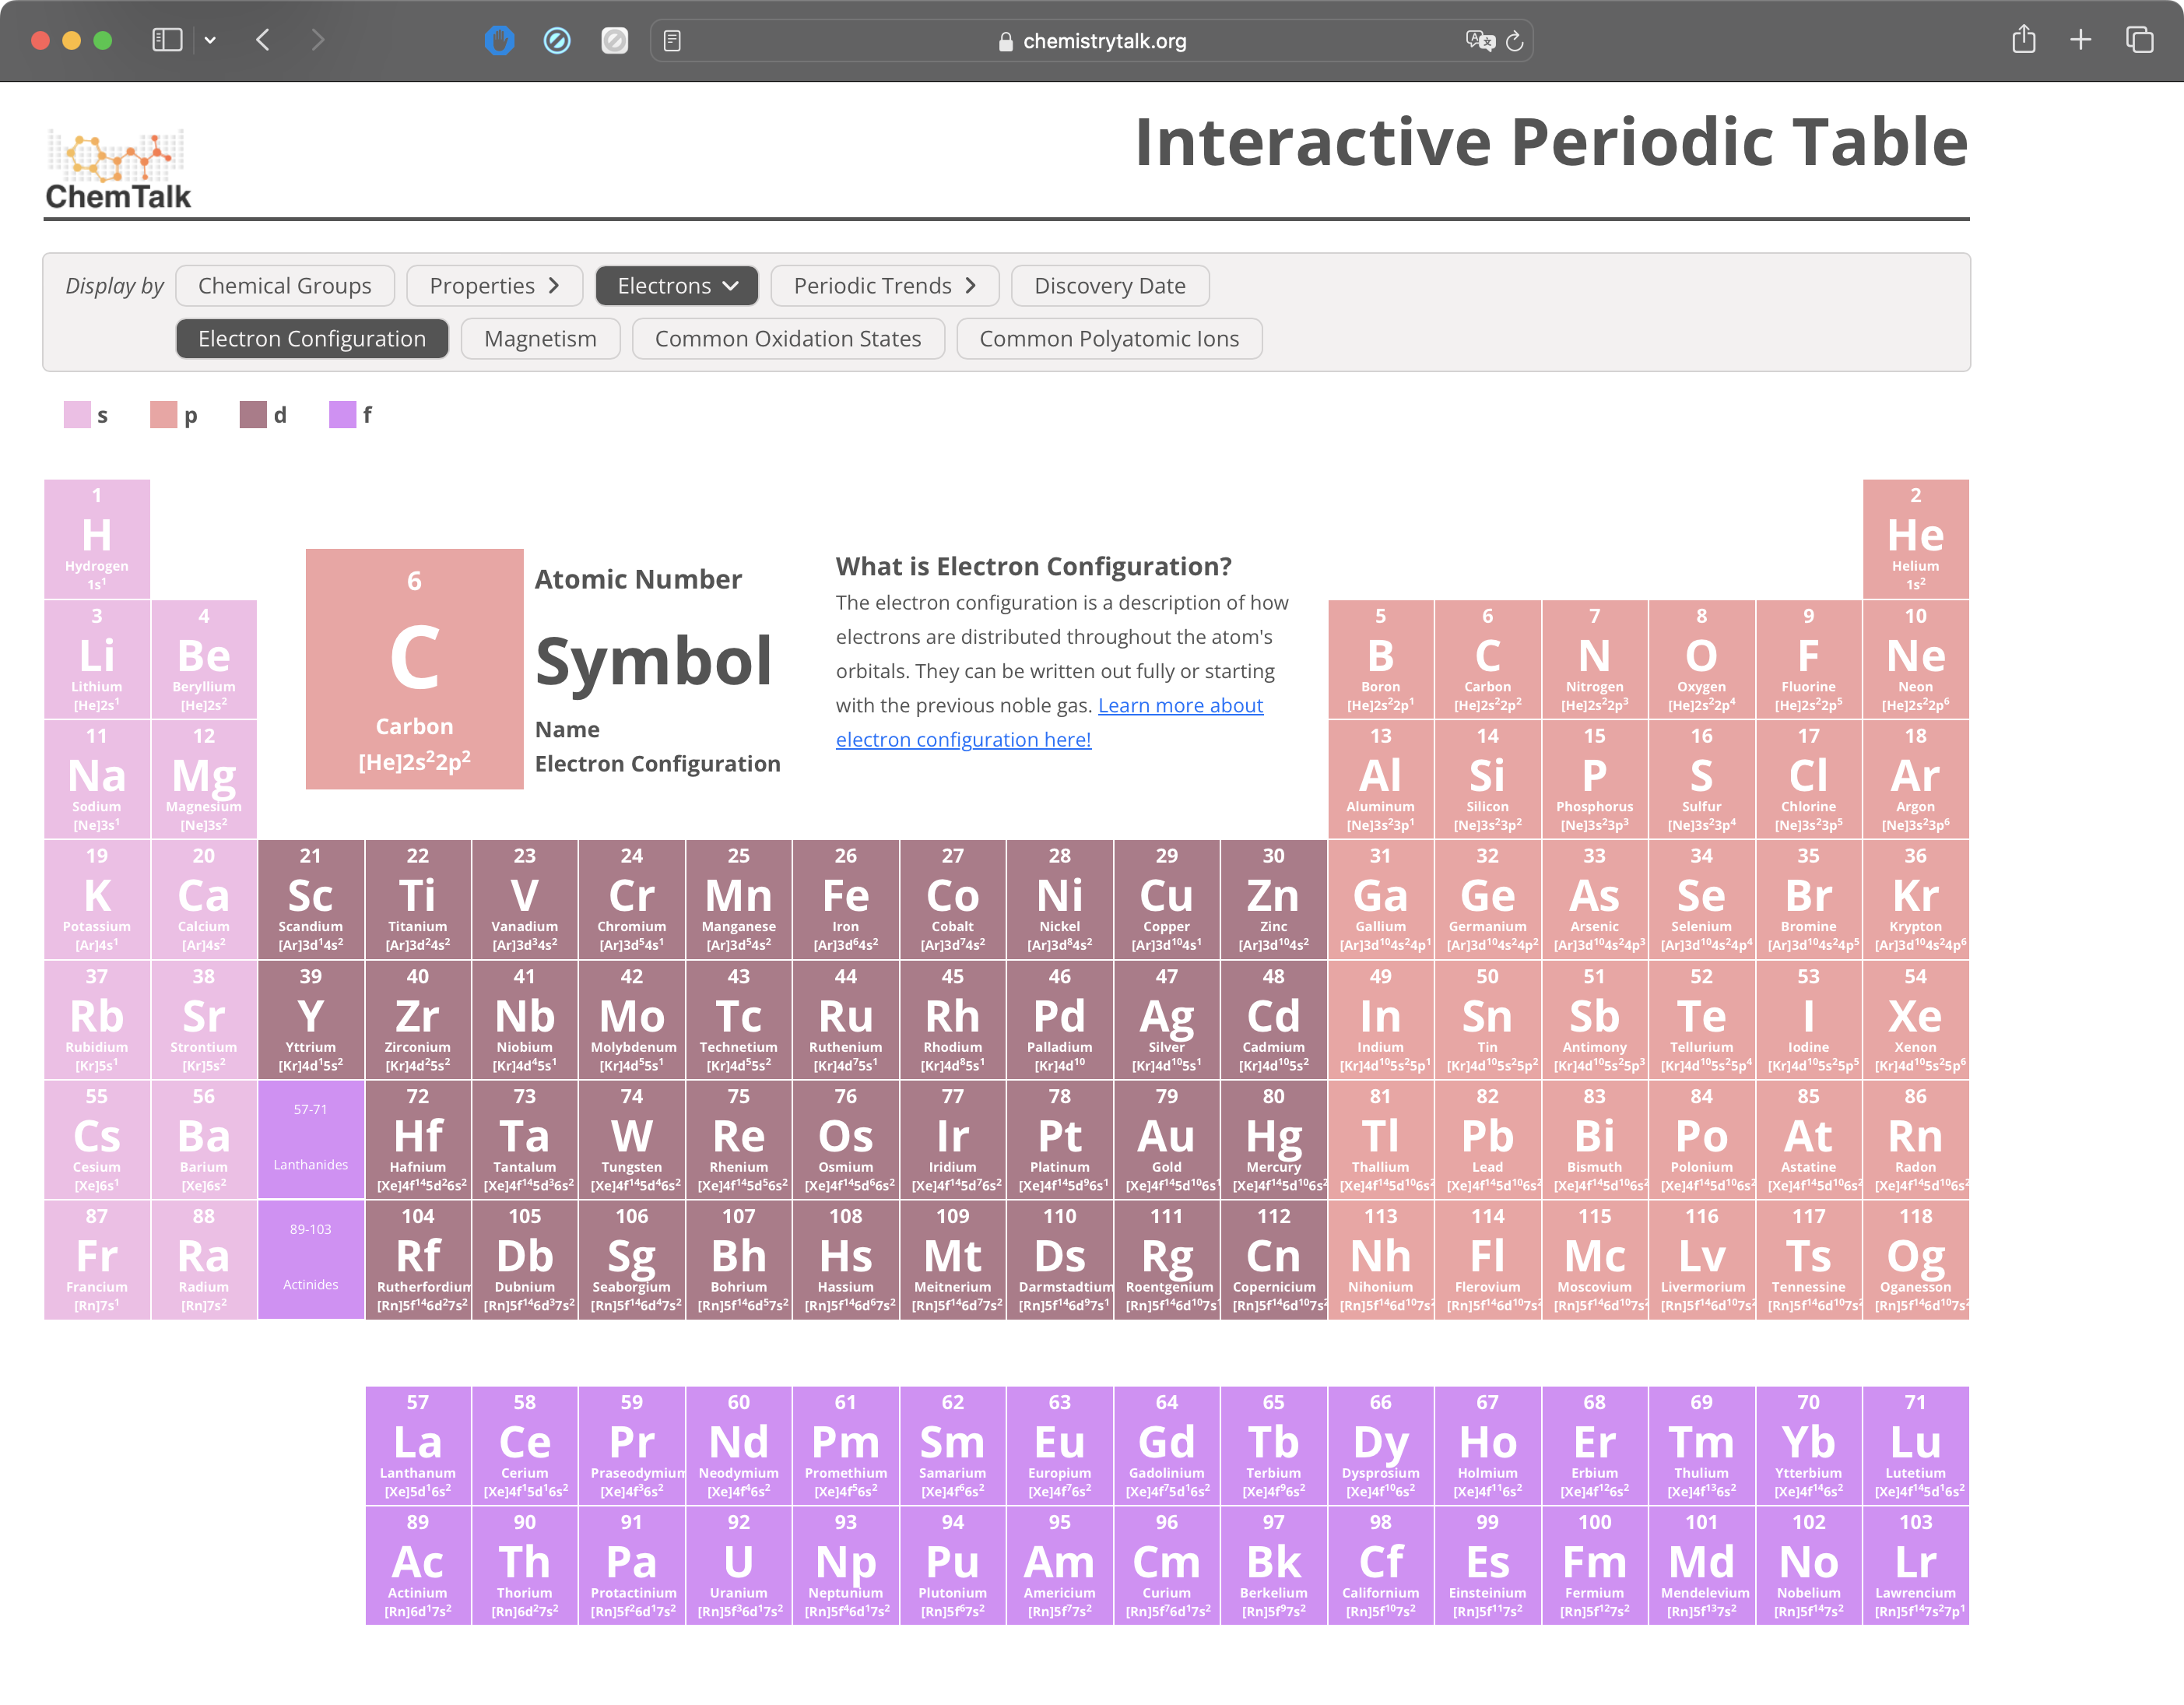
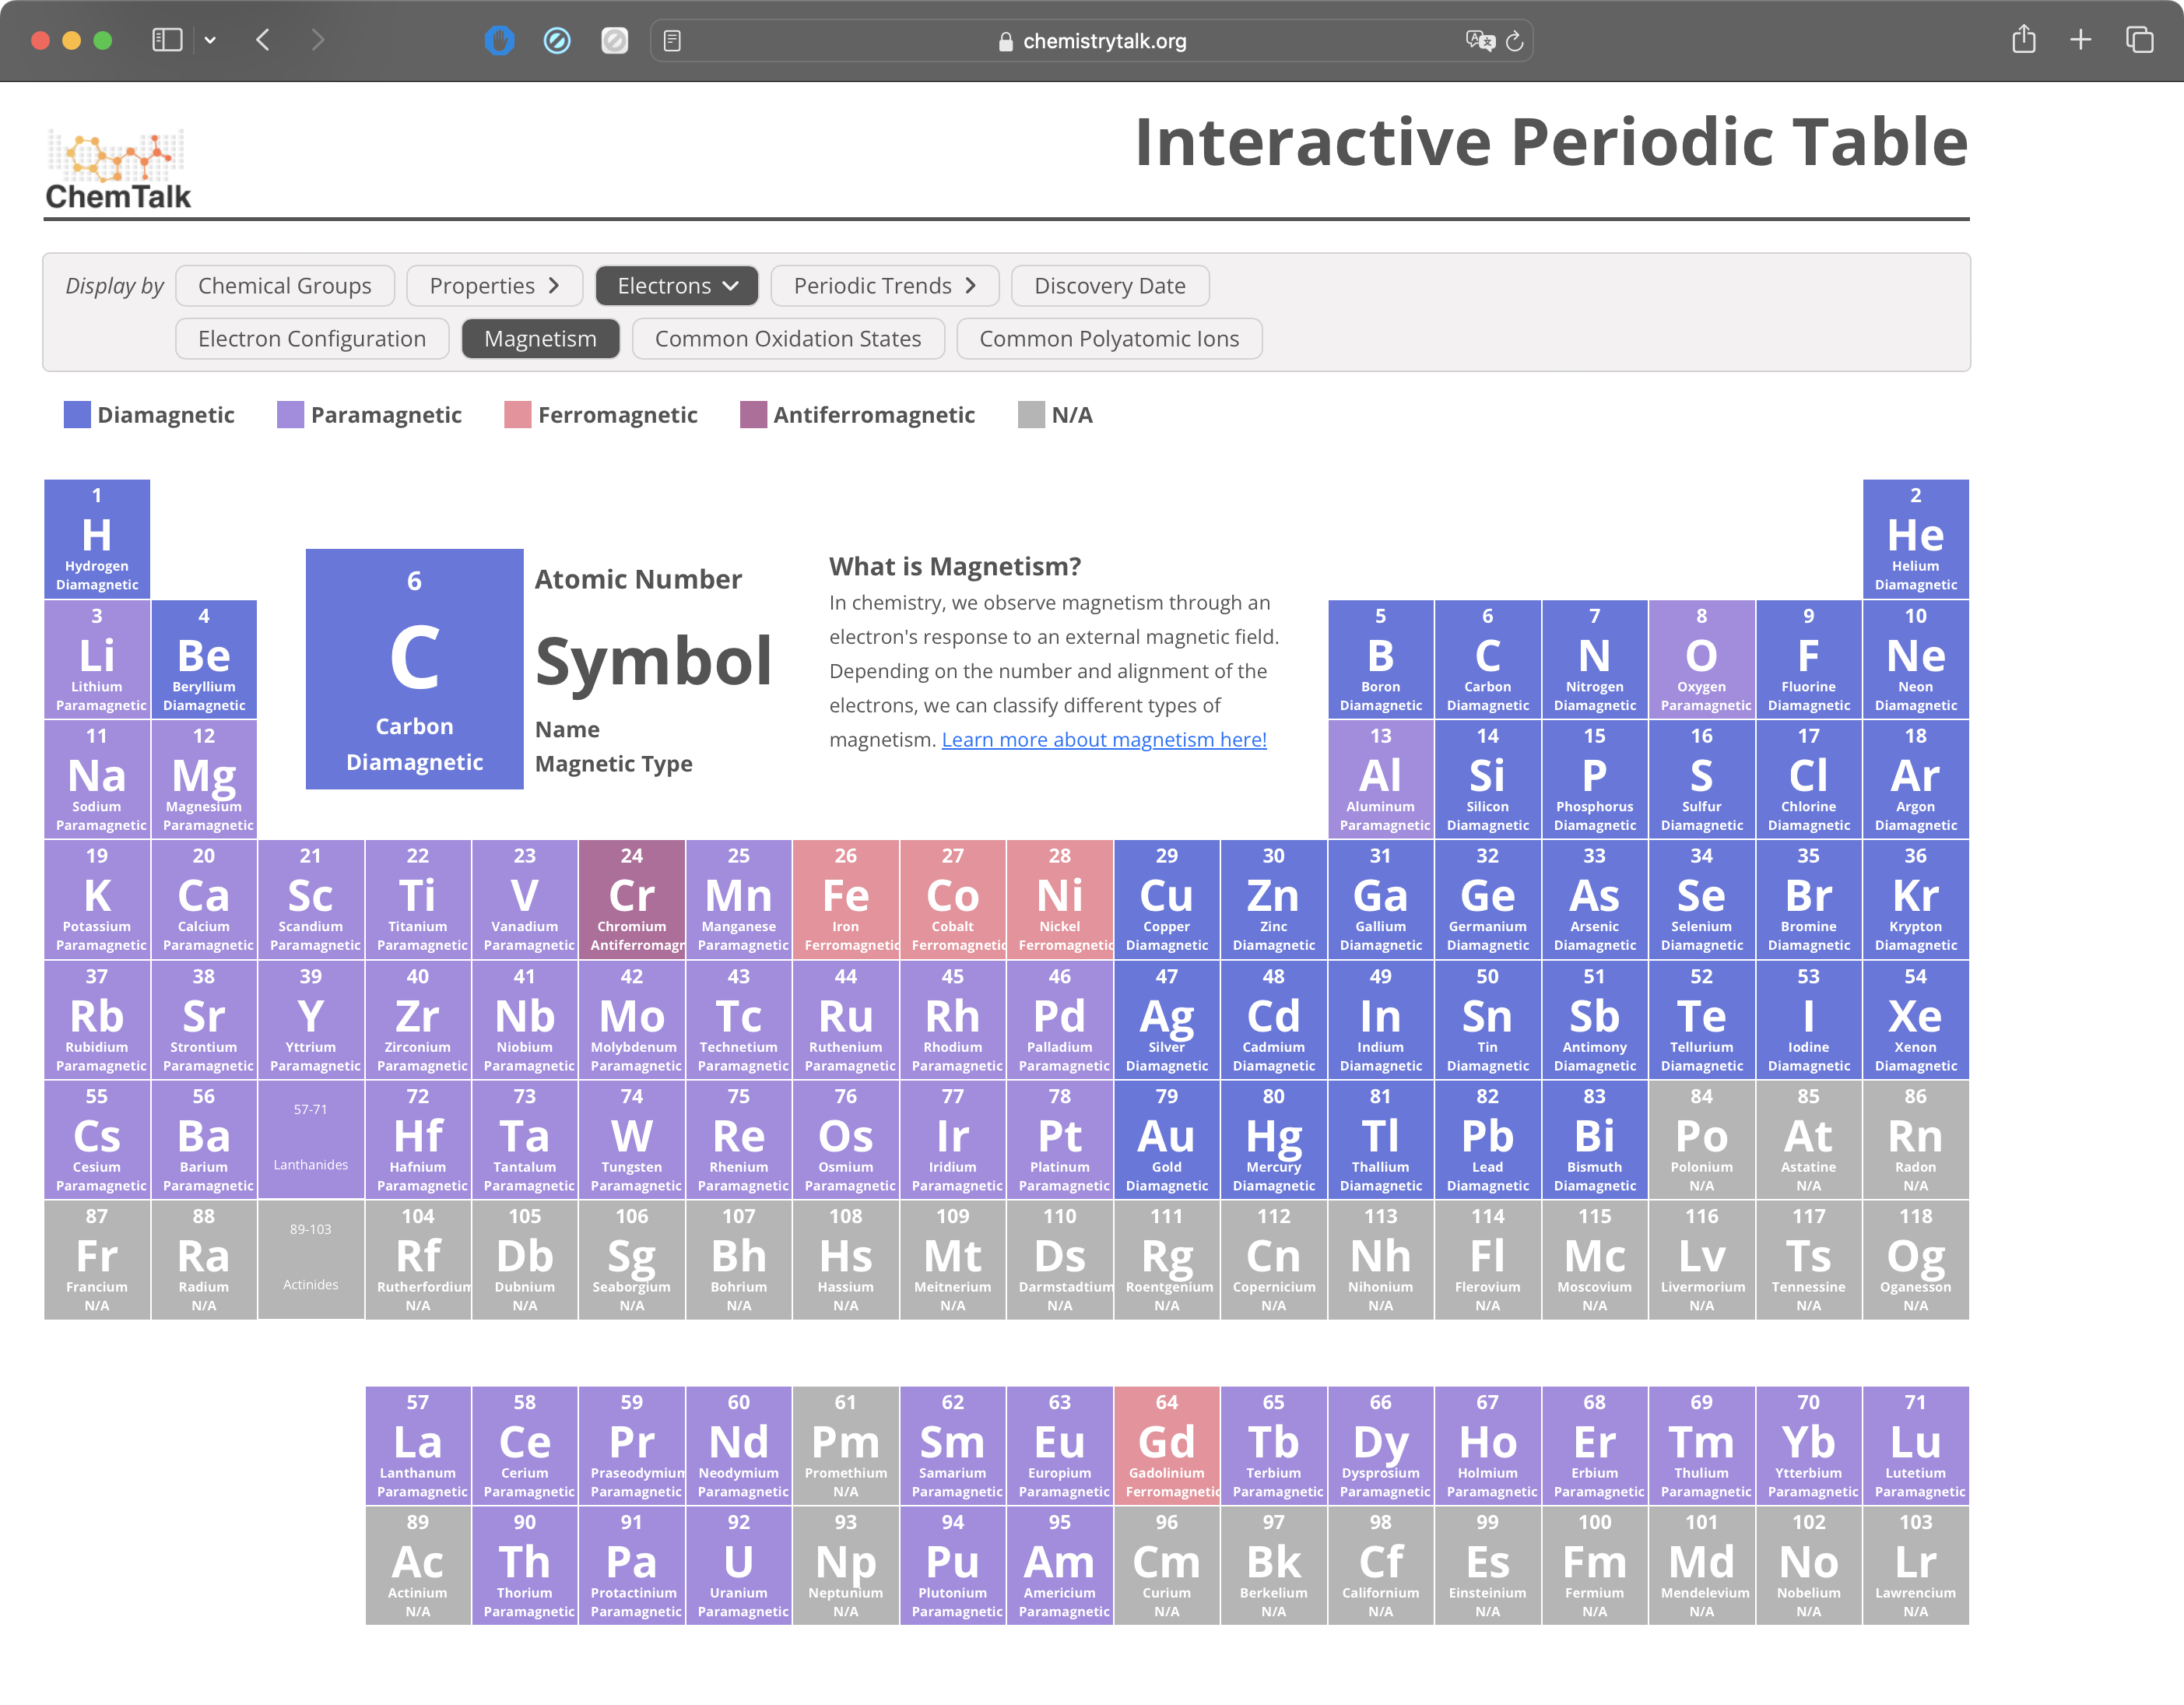
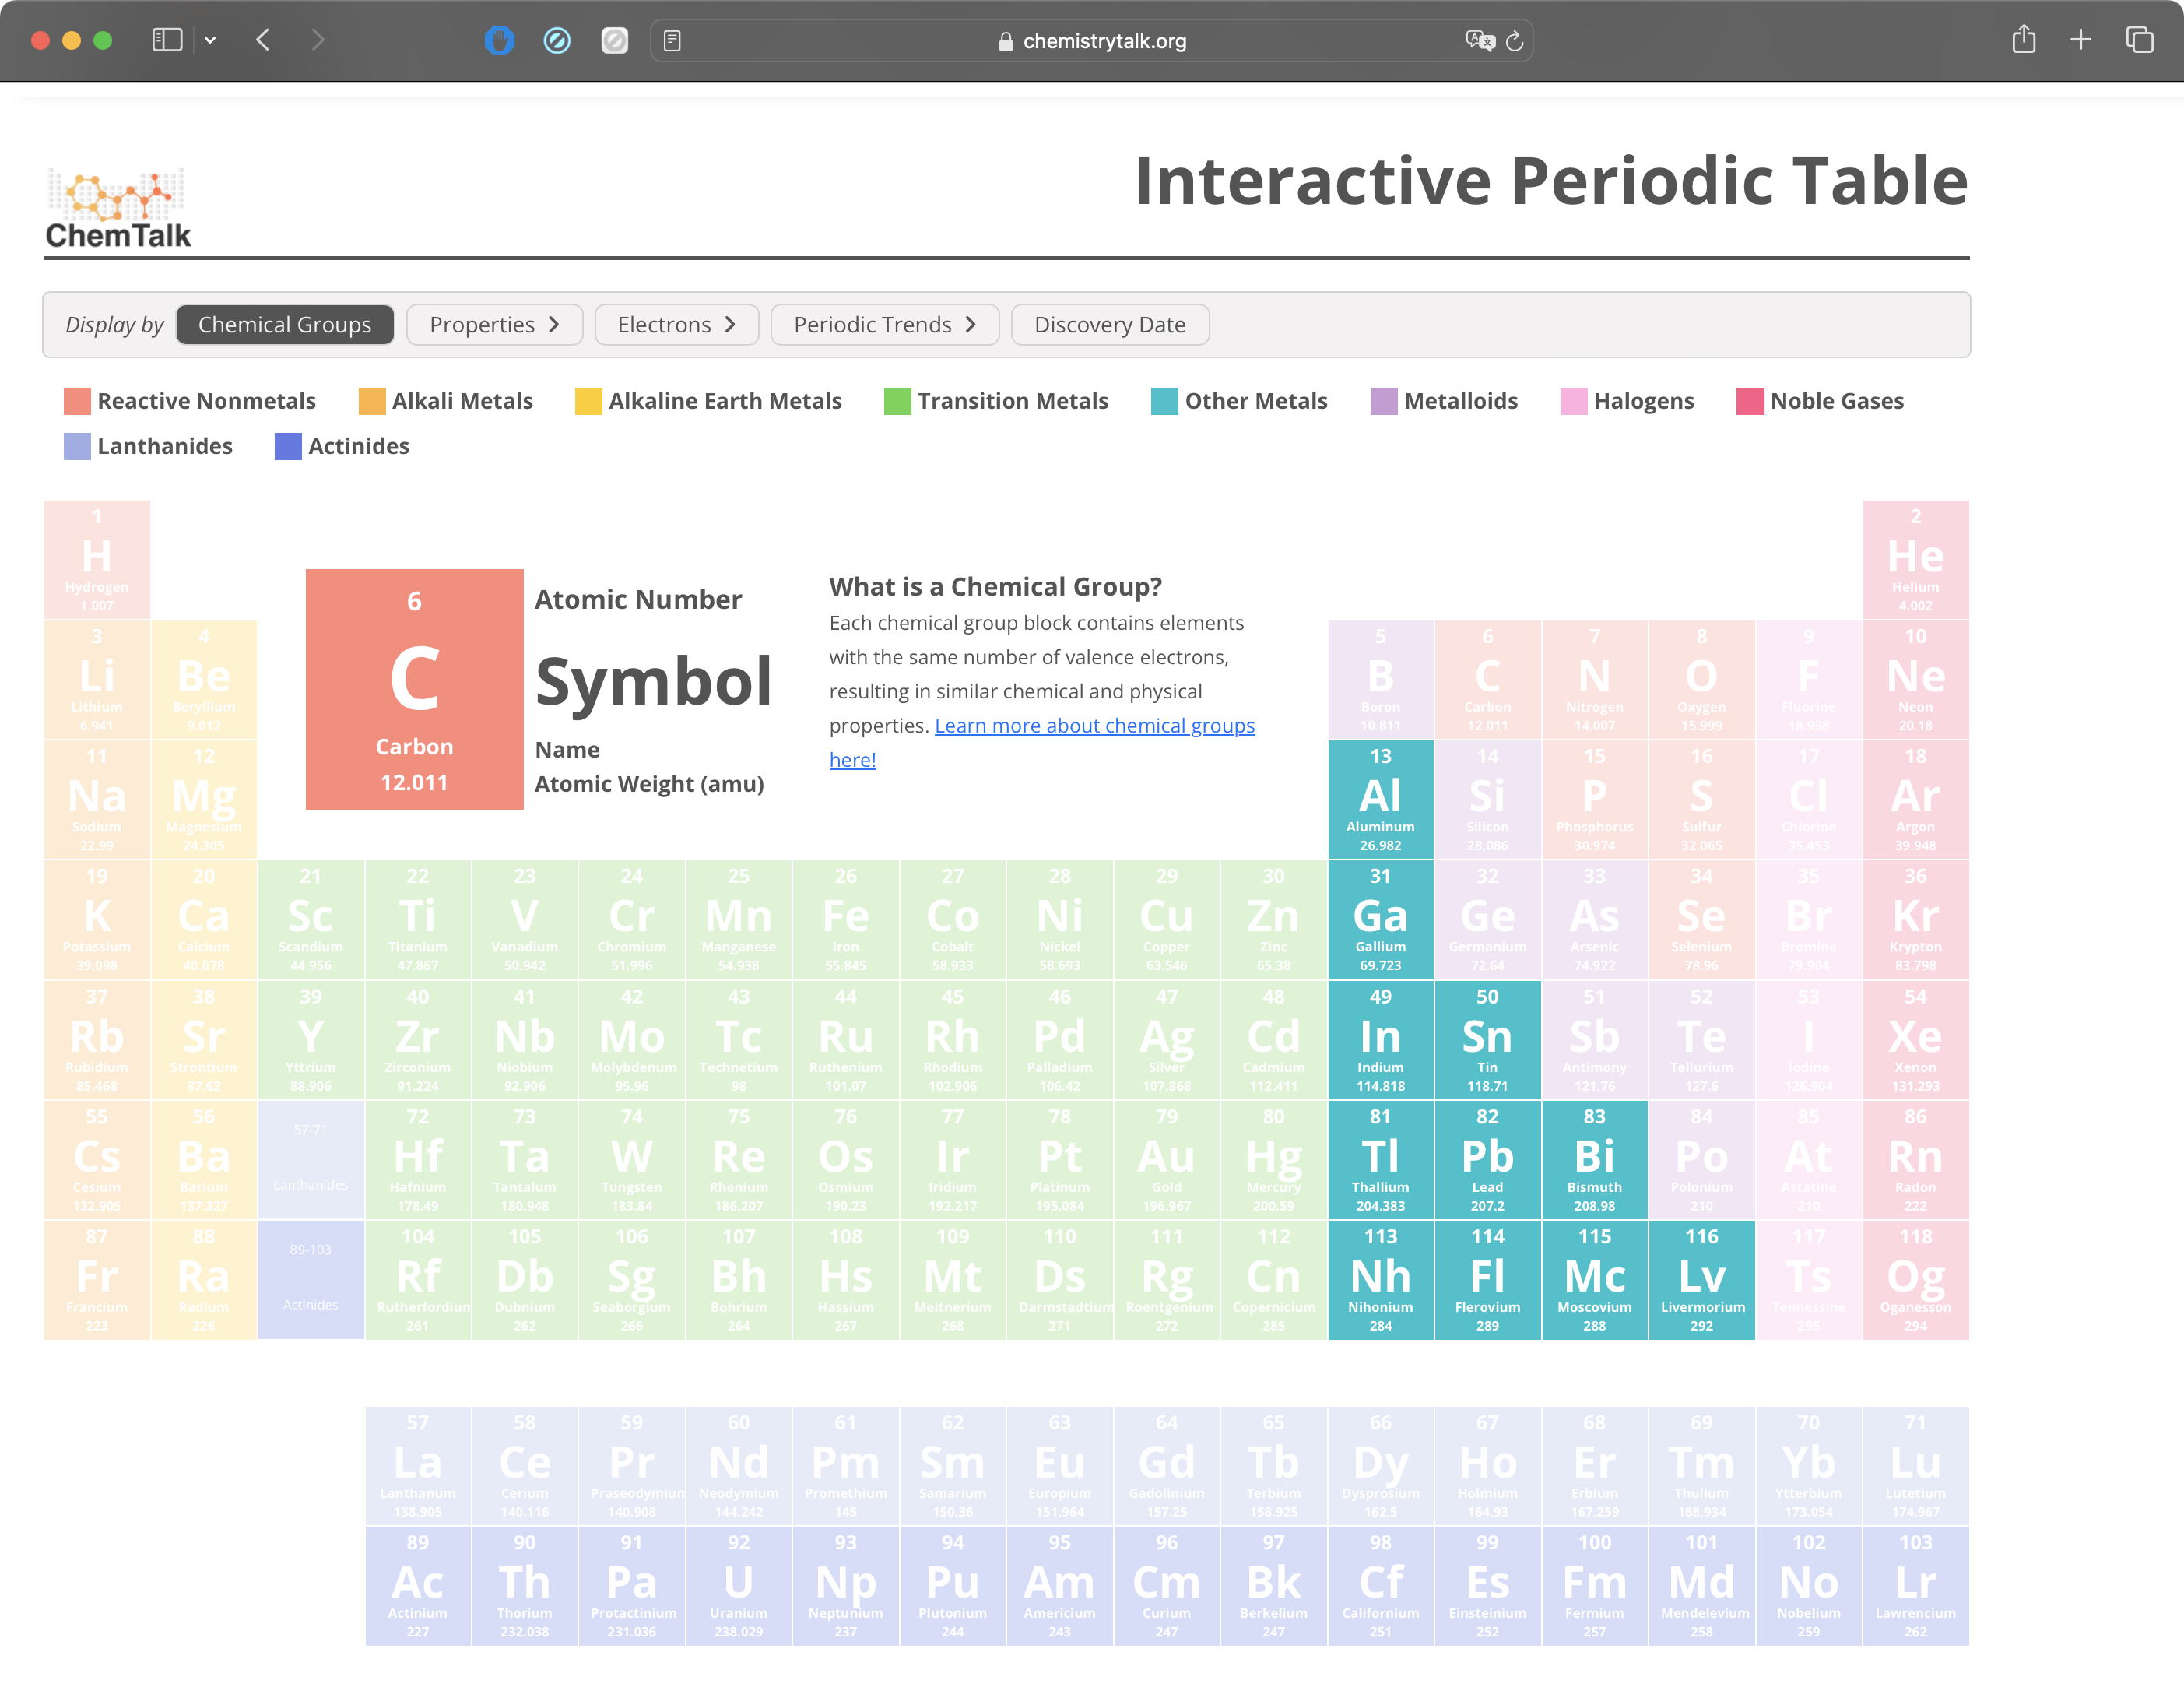
Finally, I wanted to make it easy for users to quickly group elements together. By adding a hover action to the key, I made it easy for users to quickly see all the elements that matched a specific property. For example, a user could hover over "Other Metals" and see which elements on the periodic table fall under that category.

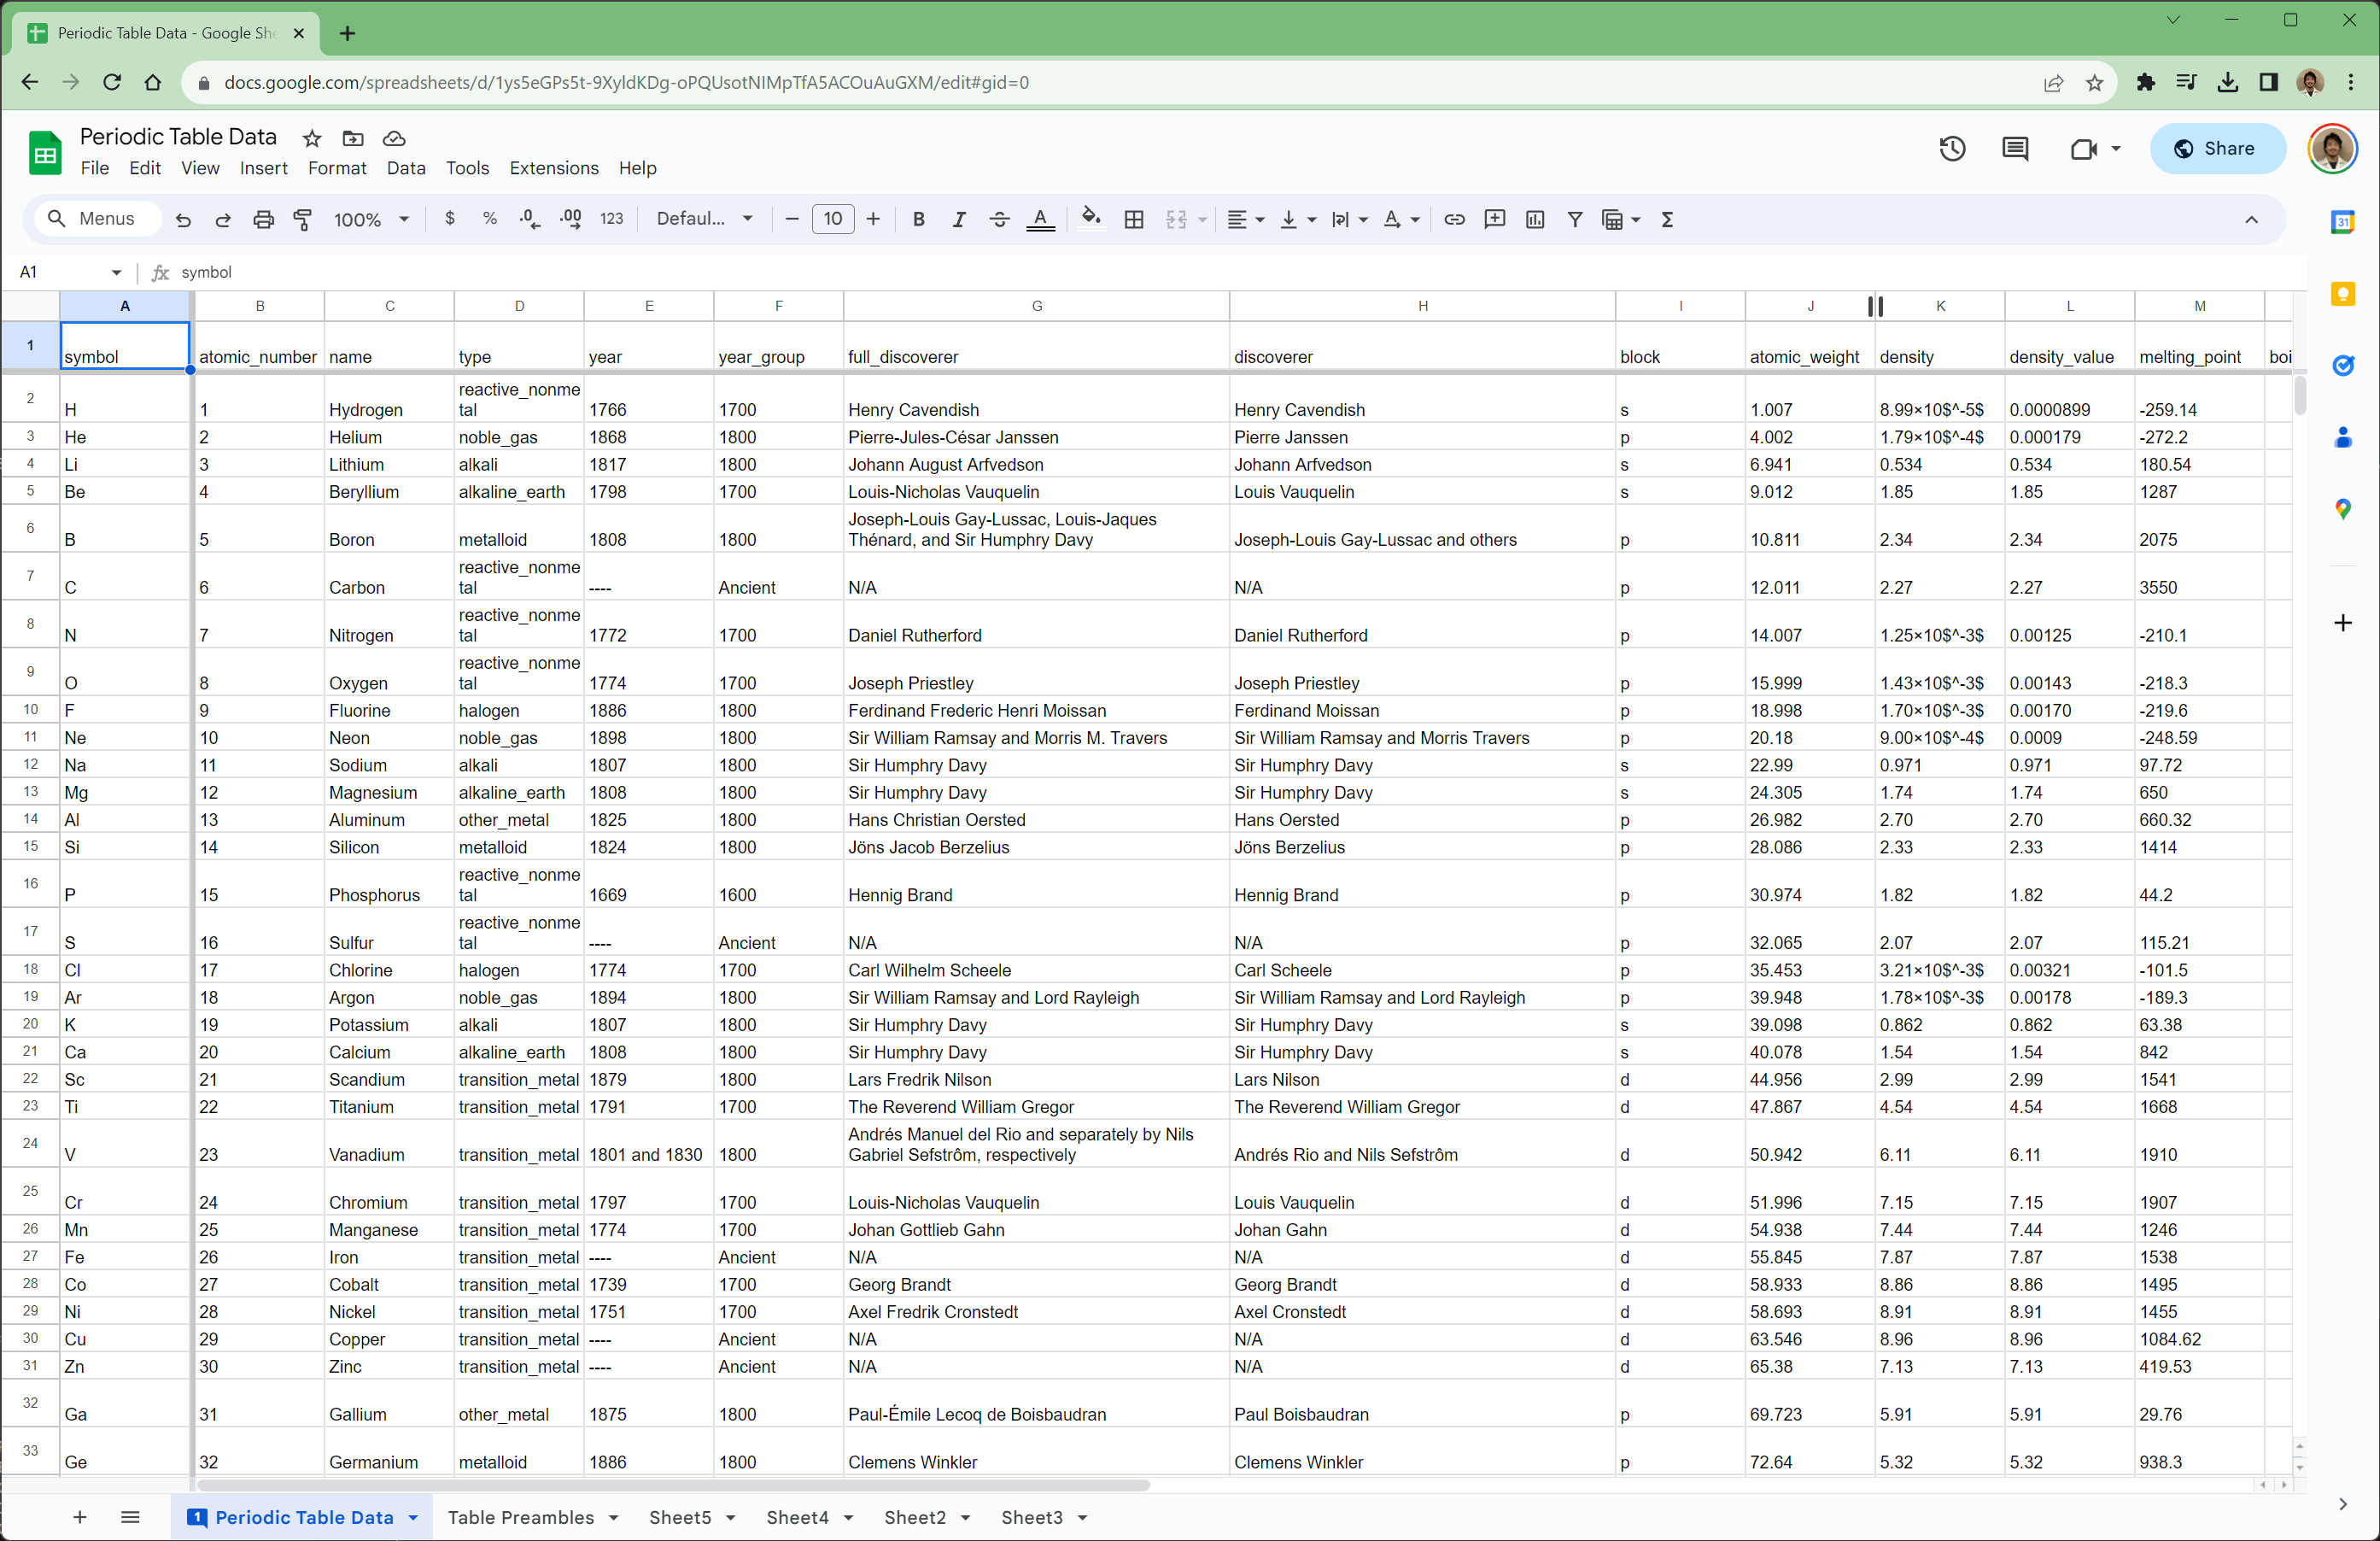
To store the data and make the table easily updatable, I created a Google Sheet with all of the data. I then wrote a python script that would take this Google Sheet and convert it to a JSON file. This file would then be loaded by the frontend and used to populate the table. This allowed me to easily update the table without having to change any of the frontend code. It also allowed me or other members of the ChemTalk team to easily add new features to the table by adding new columns to the Google Sheet.
In the future, I plan on adding more functionality to the table. For example, I've been working on a WebGL graphics engine that I will use to render the electron density orbitals and configurations of each element when you click on it.
I built this periodic table using vanilla HTML, CSS, and JS. Normally, I would rather use React for a webapp like this, but there were very strict requirements on how it could be hosted that made it more difficult to do this. In the future, I will be rebuilding this in react and hosting it on a separate domain to make it easier to maintain and host.
You can view this table on the ChemTalk website by clicking the button below.
